Showing posts with label 5. BI Reporting. Show all posts

Wednesday, December 30, 2020

How to design Tableau interactive reports

How to design Tableau interactive reports 01 - Make columns flexible

1.    Create a parameter  [Select a Dimension]

a.    Make string

b.    Make a list

c.    YYYYMM, PRODUCT_DOMAIN,REGION …

2.    Create a calculated Field  [Dimension Selected]

a.    CASE [Select a Dimension]

WHEN ‘YYYYMM’ THEN [YEARMONTH]

WHEN ‘PRODUCT_DOMAIN’ THEN [PRODUCT_DOMAIN]

WHEN ‘REGION’ THEN [REGION]

END

3.    Drag [Dimension Selected] into the view, and show parameter control


How to design Tableau interactive reports 02 - Make measure flexible

1.    Create a parameter  [Select a Measure]

a.    Make string

b.    Make a list

c.    OUTSTANDING_BALANCE, ORIG_BURSCORE, CURR_BURSCORE …

2.    Create a calculated Field  [Measure Selected]

a.    CASE [Select a Measure]

WHEN ‘OUTSTANDING_BALANCE’ THEN [OUTSTANDING_BALANCE]

WHEN ‘ORIG_BURSCORE’ THEN [ORIG_BURSCORE]

WHEN ‘CURR_BURSCORE’ THEN [CURR_BURSCORE]

END

3.    Drag [Measure Selected] into the view, and show parameter control


How to design Tableau interactive reports 03 - Make filters flexible

1.    Create a parameter  [Select a Filter]

a.    Make string

b.    Make a list

c.    YYYYMM, PRODUCT_DOMAIN,REGION …

2.    Create a calculated Field  [Filter Selected]

a.    CASE [Select a Dimension]

WHEN ‘YYYYMM’ THEN [YEARMONTH]

WHEN ‘PRODUCT_DOMAIN’ THEN [PRODUCT_DOMAIN]

WHEN ‘REGION’ THEN [REGION]

END

3.    Show parameter control

4.    Drag [Filter Selected] into Filter, select List and show filter.

How to make color conditional style consistent for HTML, PDF and EXCEL

This is a practical sample to make color conditional style beautiful with round.  Excel spreadsheet doesn’t support such a round color. This article provides a way to make all three format be consistent


HTML format
PDF format


 EXCEL format


Make color conditional style beautiful with round for both HTML and PDF, while this definition won’t show color for excel

Add new block to list cell, and specify an appropriate size


Define conditional style


Use advanced style with round


Use advanced style with color


Make color conditional style for EXCEL, while this definition won’t show color for HTML and PDF.

How to extract from PATH with /Level1/Level2/Level3/Level5 in Cognos expression

Solution 1:


Step 1:  Determine LEVEL
case INSTR([PATH], '/', 1, 2)
   when 0 then 1
   else
   (case INSTR([PATH], '/', 1, 3)
      when 0 then 2
      else
      (case INSTR([PATH], '/', 1, 4)
         when 0 then 3
         else
         (case INSTR([PATH], '/', 1, 5)
            when 0 then 4
            else
            (case INSTR([PATH], '/', 1, 6)
               when 0 then 5
               else
               (case INSTR([PATH], '/', 1, 7)
                  when 0 then 6
                  else
                  (case INSTR([PATH], '/', 1, 8)
                     when 0 then 7
                  end)
               end)
            end)
         end)
      end)
   end)
End

Step 2:  Extract LEVEL x
CASE WHEN [LEVEL] = x  THEN
 SUBSTRING([PATH],INSTR([PATH], '/', 1, x)+1)
ELSE
 SUBSTRING([PATH],INSTR([PATH], '/', 1, x)+1,  INSTR([PATH], '/', 1, x+1) - INSTR([PATH], '/', 1, x) - 1)
END


Samples
Level1
CASE WHEN [LEVEL] = 1  THEN
 SUBSTRING([PATH],INSTR([PATH], '/', 1, 1)+1)
ELSE 
 SUBSTRING([PATH],INSTR([PATH], '/', 1, 1)+1, INSTR([PATH], '/', 1, 2) - INSTR([PATH], '/', 1, 1) - 1)
END
Level2
CASE WHEN [LEVEL] = 2  THEN
 SUBSTRING([PATH],INSTR([PATH], '/', 1, 2)+1)
ELSE
 SUBSTRING([PATH],INSTR([PATH], '/', 1, 2)+1, INSTR([PATH], '/', 1, 3) - INSTR([PATH], '/', 1, 2) - 1)
END
Level3
CASE WHEN [LEVEL] = 3  THEN
 SUBSTRING([PATH],INSTR([PATH], '/', 1, 3)+1)
ELSE
 SUBSTRING([PATH],INSTR([PATH], '/', 1, 3)+1, INSTR([PATH], '/', 1, 4) - INSTR([PATH], '/', 1, 3) - 1)
END
Level4
CASE WHEN [LEVEL] = 4  THEN
 SUBSTRING([PATH],INSTR([PATH], '/', 1, 4)+1)
ELSE
 SUBSTRING([PATH],INSTR([PATH], '/', 1, 4)+1,  INSTR([PATH], '/', 1, 5) - INSTR([PATH], '/', 1, 4) - 1)
END
Level5
CASE WHEN [LEVEL] = 5  THEN
 SUBSTRING([PATH],INSTR([PATH], '/', 1, 5)+1)
ELSE
 SUBSTRING([PATH],INSTR([PATH], '/', 1, 5)+1, INSTR([PATH], '/', 1, 6) - INSTR([PATH], '/', 1, 5) - 1)
END


Solution 2:


Extract LEVEL x
CASE WHEN INSTR([PATH], '/', 1, x) > 0 AND INSTR([PATH], '/', 1, x+1) = 0  THEN
 SUBSTRING([PATH],INSTR([PATH], '/', 1, x)+1) 
ELSE
 SUBSTRING([PATH],INSTR([PATH], '/', 1, x)+1, INSTR([PATH], '/', 1, 3) - INSTR([PATH], '/', 1, x) - 1)
END


Sample

Level 2
CASE WHEN INSTR([PATH], '/', 1, 2) > 0 AND INSTR([PATH], '/', 1, 3) = 0  THEN
 SUBSTRING([PATH],INSTR([PATH], '/', 1, 2)+1) 
ELSE
 SUBSTRING([PATH],INSTR([PATH], '/', 1, 2)+1, INSTR([PATH], '/', 1, 3) - INSTR([PATH], '/', 1, 2) - 1)
END


Level 3
CASE WHEN INSTR([PATH], '/', 1, 3) > 0 AND INSTR([PATH], '/', 1, 4) = 0  THEN
 SUBSTRING([PATH],INSTR([PATH], '/', 1, 3)+1) 
ELSE
 SUBSTRING([PATH],INSTR([PATH], '/', 1, 3)+1, INSTR([PATH], '/', 1, 4) - INSTR([PATH], '/', 1, 3) - 1)
END

Tuesday, August 4, 2020

Using Cognos framework manager parameter maps for data-level security for unbalanced ragged hierarchy

This article will document an exciting solution to satisfy a unique requirement for Cognos data-level security scenario. For explanation, we use the picture below as sample data to start.


Please note that individual users should see the total data for all nodes; in other words, the data for each node should be the same for all different cases. The security is to check whether it allows a user to see it.

The challenge: we can not use the traditional RLS filter concept to put it into the hierarchy, as we will filter data out. The other option is to add a huge bridge table between hierarchy and facts and get data not filtered out. However, the problem with this idea is that the combination for the actual situation is too big, which could result in billions of records. Therefore, we need to think about how to mask the hierarchy to what node allows users to see. While all other nodes should be hidden or suppressed, the data join should not be impacted.

Use the script below to get data setup,

Then the hierarchy will be looks as follows

The report looks like the below.


Now the security problem to how to make data level security work.  use SQL script below to enhance the data, the reason we use more columns is to  have the best performance and easy to compare simply

then we can create another table to assign users to
all nodes, or any nodes, such as
user 1   999999
user 2  1,2
user 3  1,2,4,5
user 4  1,2,5

Create parameter map as about; then we can mask data in the business layer as
L1:
case when
999999 in (#$DataLevelSecurity{$account.personalInfo.userName}#)
or [Data Layer].[HS].[L1_SK] in (#$DataLevelSecurity{$account.personalInfo.userName}#)
then [Data Layer].[HS].[L1]  else '' end

L1_Caption:
case when
(999999 in (#$DataLevelSecurity{$account.personalInfo.userName}#) and [Data Layer].[HS].[L1]  <> '' )
or ( [Data Layer].[HS].[L1_SK] in (#$DataLevelSecurity{$account.personalInfo.userName}#) and [Data Layer].[HS].[L1]  <> ''  )
then [Data Layer].[HS].[L1]  else '-' end

Now for user 1 is the same as above, as User 1 can see everything.

User 2
FM model:
Report:

User 3
FM model:

Report:


User 4
FM model:

Report:

Friday, May 1, 2020

How to set different colors for each column in bar chart

There are simple steps to get set different colors for each column in bar chart.
Step 1: Create basic chart showing single color.
Step 2: Show value on chart by specifying Show Values for series.

Step 3: Further specify color scheme for category based on category value


Sunday, September 1, 2019

How to make Cognos chart tooltip support multilingual

(Special note: This solution below is applicable for traditional chart only. if you use visualizations, then the most effective way is to duplicate final queries and change labels to Spanish.  )


Please see two attached graph below to show tooltip with both English and Spanish. This document documents all steps in detail.

Step 1: Change category, e.g. Year, locate it under chart node number.

Then make Custom Label as Show, text box will appear under category.

Then Click text box, make Text source variable as Localization, signs it as default text.

Click Spanish, and assign Spanish text for chart.

Step 2: Apply for Series using the same approach

Step 3: Change default measure

Then make Custom Label as Show, text box will appear in chart area.

Then Click text box, make Text source variable as Localization, signs it as default text; Click Spanish, and assign Spanish text for chart.

Thursday, February 1, 2018

How to create a report running current month by default or date range if specified

This document is intended to share two solution tips, which can applied for many difference cases.
Given that we need to create a report to satisfy requirements:
1) This report can be scheduled without any specifying parameter, by default, it will execute with current month.
2) This report can specify data range if needed.
Based on this requirement, we need to create a prompt page as below


If user select specify data range, then start date and end date will appear for users to spcifiy.

Create a fake value prompt to avoid refreshing report
When a user change the option from current month to specify date range, the start date and end date will be appear.  Obviously, you need to make prompt to set up as auto prompt.


Doing so will make report submit right away and move to real report page. To avoid this action, we need to make a faked value prompt to take  value from the selection.  We need to also make this faked value as NOT visible


Certainly, we need to make date range conditional with render variable


Make filter optional to allow user and Cognos schedule to run report against current month

Make default moth is used when date range is not specified. Cognos can only support  case 1 (IF
THEN) and  case 2 (CASE WHEN), doesn’t support the 3rd case.  Make sure this filter is OPTIONAL.

 
Case 1: filter works, as Cognos send SQL after applying the filter, in this case, ( [Sales (query)].[Time].[Date] BETWEEN _first_of_month(_add_months (current_date, -1 ))

if ( ?p_selected? = 'CURRENT'  ) THEN     
 ( [Sales (query)].[Time].[Date] BETWEEN _first_of_month(_add_months (current_date, -1 )) AND _last_of_month (_add_months (current_date, -1 )))
ELSE ( [Sales (query)].[Time].[Date]   BETWEEN ?Report Start Date? AND ?Report End Date? )


Case 2: Filter works , same reason as above

CASE WHEN ( ?p_selected? = 'CURRENT'  ) THEN     
 ( [Sales (query)].[Time].[Date] BETWEEN _first_of_month(_add_months (current_date, -1 )) AND _last_of_month (_add_months (current_date, -1 )))
ELSE ( [Sales (query)].[Time].[Date]   BETWEEN ?Report Start Date? AND ?Report End Date? )
END


Case3 filter doesn’t work, as Cognos doesn’t know how to handle another two filters. In this case, the filter WON’T apply at all. all data will be retrieved.

(
 ( ?p_selected? = 'CURRENT'  ) 
 AND
  ( [Sales (query)].[Time].[Date] BETWEEN _first_of_month(_add_months (current_date, -1 )) AND _last_of_month (_add_months (current_date, -1 )))
)
OR
(
 ( ?p_selected? <> 'CURRENT'  ) 
 AND
 ( [Sales (query)].[Time].[Date]   BETWEEN ?Report Start Date? AND ?Report End Date? )
)

Tuesday, January 2, 2018

How to Design Effective Cognos Report Studio Templates

1 Context
There are many articles to address this topic. Instead of showing you the generic solution, this document is intended to provide a few tips to resolve a few practical problems, listed below
1) Separate report template from layout components
2) Define all styles in report template
3) Make title/header/footer dynamic based report description
4) Share the same report template for both excel and PDF
5) Make more detail report pages in report template with accurate size
 

2 Separate report template from layout components
The layout components mainly refers page header, page footer and page title. We want to make sure that these changes should be changed only once if needed. Therefore, we need to define layout components as many as possible, and then make report template to use these components as references. Report developers do not need to make report header and footer to point components any more.
 

3 Define all styles in report template
If we want to make report style for list and crosstab, we can change Global Class Extensions as well as define local Classes. If we change Global Class Extensions as proposed standard, then any reports applied this template will use the defined style. The problem is that we cannot change template once and reflect this change for all reports, as it doesn’t work the same way as layout component reference. The local Classes are very useful to standardize reports as well, in addition, this concept can be applied for active report development to reduce mht file size.


4 Make title/header/footer dynamic based report description
As report name appears on report for every pages including report title. However, sometimes you can not change report name once developed as the report name may be used in report schedule. The solution is to leverage report description. If report description will override report name.

Please note that report description is not saved in report specification, therefore, report description won’t be available when running report from report studio, and report name will be displayed. However, report description will be displayed for end users and scheduled output.
The script for report title for layout calculation is below
if (character_length(ReportDescription ()) = 0 ) then (ReportName ()) else (ReportDescription())


5 Share the same report template for both excel and PDF
As PDF and EXCEL output is different, using the same report footer and header is impossible. One of main problem is that the columns length is NOT based on report contents such as list and crosstab duo to the impact from report footer.  The idea is to make report header and footer to be selected based on the report output. For example, we can make footer as block as layout component reference. Two blocks within this block will be defined as EXCEL block and PDF block. Then we can use conditional rendering to proceed.
 

6 Make more detail report pages in report template with accurate size
As known, the size is very important to control, especially when charts and tables are combined on same page. We don’t want chart size to impact on table. The solution is to specify the exact size for both charts and tables, so that report will be generated as exact as expected when apply predefined template.

Tuesday, October 11, 2016

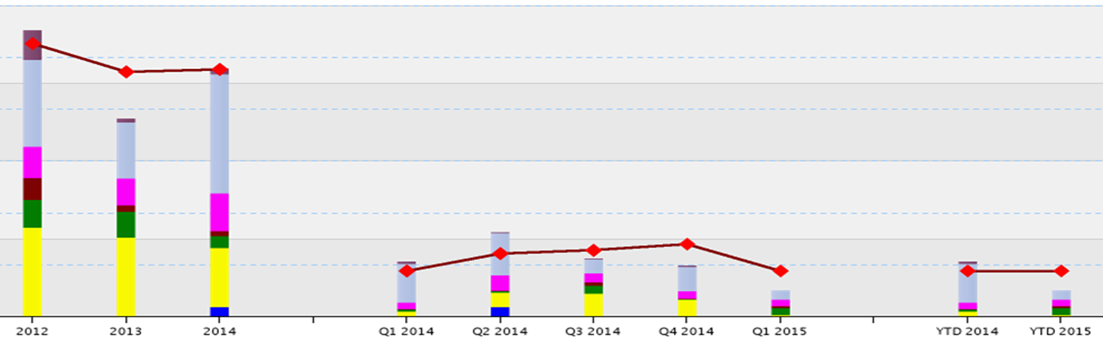
How to make column chart with breaks – update – with high performance

This report is based on Ex post How to make column chart with breaks against ORACLE database.  It is intended to figure out solution to develop this report with best performance.


Sort by SortGroup, Sort Year, xCategory

1
2
3
4
5
6
7
8
9
10
11
12
SortGroup
1
1
1
2
3
3
3
3
3
4
5
5
Year
2013
2014
2015
S1
2014
2014
2014
2014
2015
S2
2014
2015
xCategory
2013
2014
2015
S1
Q1 2014
Q2 2014
Q3 2014
Q4 2014
Q1 2015
S2
YTD 2014
YTD 2015


Filters: (Do not use cast, as it will use local process)
3 Year
to_char(to_number(nvl([Year data item], 0))+1)=?p_year?  OR
to_char(to_number(nvl([Year data item], 0))+2)=?p_year? OR
to_char(to_number(nvl([Year data item], 0))+3)=?p_year?


5 Quarters
( to_char(to_number(nvl([Year data item], 0))+0)=?p_year? and
[Quarter data item] <=?p_quarter? )
OR
( to_char(to_number(nvl([Year data item], 0))+1)=?p_year? and
[Quarter data item] >=?p_quarter? )


2 YTDs
( to_char(to_number(nvl([Year data item], 0))+0)=?p_year? and
[Quarter data item] <=?p_quarter? )
OR
( to_char(to_number(nvl([Year data item], 0))+1)=?p_year? and

[Quarter data item] <=?p_quarter? )