Showing posts with label 1. Solution Architect. Show all posts

Saturday, December 13, 2025

Standardizing Entity-Based Row-Level Security in Power BI

 From Architecture Vision to a Production-Ready Implementation Template


Introduction

As Power BI adoption grows across business domains, security quickly becomes one of the hardest problems to scale. Many organizations start with good intentions but end up with duplicated datasets, inconsistent access rules, manual fixes, and performance bottlenecks—especially when hierarchical access is involved.

This blog presents a complete, ready-to-publish reference architecture and implementation template for Entity-based Row-Level Security (RLS) in Power BI. It combines conceptual design, governance principles, and a hands-on implementation blueprint that teams can reuse across domains such as revenue, cost, risk, and beyond.

The goal is simple:
👉 One conformed security dimension, one semantic model, many audiences—securely and at scale.


Executive Summary

The proposed solution standardizes on Entity as the single, conformed security dimension (SCD Type 1) driving dynamic RLS across Power BI datasets.

User access is centrally managed in the Business entity interface application, synchronized through ETL, and enforced in Power BI using native RLS. Where higher-level access is required, Department-based static roles complement the dynamic model. A FullData role supports approved no-security use cases—without duplicating datasets.

The result is a secure, scalable, auditable, and performance-friendly Power BI security framework that is production-ready.


Why Entity-Based Security?

Traditional Power BI security implementations often suffer from:

  • Dataset duplication for different audiences

  • Hard-coded filters and brittle DAX

  • Poor performance with deep hierarchies

  • Limited auditability and governance

An Entity-based security model solves these problems by:

  • Introducing a single conformed dimension reused across all facts

  • Separating entitlements from data modeling

  • Supporting both granular and coarse-grained access

  • Scaling naturally as new domains and fact tables are added

Entity becomes the language of access control across analytics.


End-to-End Security Flow

At a high level, the solution works as follows:

  1. Business entity interface application maintains user ↔ Entity entitlements

  2. ETL processes refresh:

    • Dim_Entity (SCD1)

    • Entity_Hier (hierarchy bridge)

    • User_Permission (effective access)

  3. Power BI binds the signed-in user via USERPRINCIPALNAME()

  4. Dynamic RLS filters data by Entity and all descendants

  5. Department-based static roles provide coarse-grained access

  6. RLS_FullData supports approved no-security audiences

All of this is achieved within a single semantic model.


Scope and Objectives

This framework applies to:

  • Power BI datasets and shared semantic models

  • Fact tables such as:

    • Fact_Revenue

    • Fact_Cost

    • Fact_Risk

    • Fact_[Domain] (extensible)

  • Entity-based and Department-based security

  • Centralized entitlement management and governance

Out of scope:

  • Database-level RLS

  • Report-level or app-level access configuration

The focus is dataset-level security governance.


Canonical Data Model

Core Tables

Dimensions & Security

  • Dim_Entity – conformed Entity dimension (SCD1)

  • Entity_Hier – parent-child hierarchy bridge

  • User_Permission – user ↔ Entity entitlement mapping

  • Dim_User (optional) – identity normalization

Facts

  • Fact_Revenue

  • Fact_Cost

  • Fact_Risk

  • Fact_[Domain]


Dim_Entity (SCD Type 1)

Entity_Key (PK) Entity_Code Entity_Name Parent_Entity_Code Entity_Level Is_Active
  • Current-state only

  • One row per Entity

  • No historical tracking


Entity_Hier (Bridge)

Parent_Entity_Key Child_Entity_Key LevelFromTop
  • Pre-computed in ETL

  • Includes self-to-self rows

  • Optimized for hierarchical security expansion


User_Permission

User_Email Entity_Key Granted_By Granted_Date
  • Source of truth: Business entity interface application

  • No calculated columns

  • Fully auditable


Fact Tables (Standard Pattern)

Example: Fact_Revenue

Entity_Key Date_Key Amount Currency Other domain attributes

Rule:
Every fact table must carry a resolvable Entity_Key.


Relationship Design (Strict by Design)

User_Permission → Entity_Hier → Dim_Entity → Facts
  • Single-direction relationships only

  • No bi-directional filters by default

  • Security propagation handled exclusively by RLS

This avoids accidental over-filtering and performance regressions.


Row-Level Security Design

1. Dynamic Entity-Based Role

Role name: RLS_Entity_Dynamic

User_Permission[User_Email] = USERPRINCIPALNAME()
Entity_Hier[Parent_Entity_Key] IN VALUES ( User_Permission[Entity_Key] )

Grants

  • Explicit Entity access

  • All descendant Entities automatically


2. Department-Based Static Role

Role name: RLS_Department_Static

Dim_Department[Department_Code] IN { "FIN", "OPS", "ENG" }

Used for:

  • Executive access

  • Oversight and aggregated reporting


3. No-Security Role

Role name: RLS_FullData

TRUE()
  • Applied only to approved security groups

  • Uses disconnected security dimensions

  • No dataset duplication


ETL Responsibilities and Governance

ETL is responsible for:

  • Maintaining Dim_Entity as SCD1

  • Regenerating Entity_Hier on Entity changes

  • Synchronizing User_Permission entitlements

  • Capturing freshness timestamps

Mandatory data quality checks

  • Orphan Entity keys

  • Missing Entity mapping in facts

  • Stale entitlement data

Governance dashboards in Power BI surface:

  • Users without access

  • Orphaned permissions

  • Entity coverage by fact table


Handling Non-Conforming Data

Not all datasets are perfect. This framework addresses reality by:

  • Cataloguing fact tables lacking Entity keys

  • Introducing mapping/bridge tables via ETL

  • Excluding unresolved rows from secured views

  • Enforcing coverage targets (e.g., ≥ 99.5%)

Security integrity is preserved without blocking delivery.


Deployment & Rollout Checklist

Dataset

  • RLS roles created and tested

  • Relationships validated

  • No calculated security tables

Security

  • All Viewer/App users assigned to a role

  • Dataset owners restricted

  • FullData role explicitly approved

Testing

  • Parent Entity sees children

  • Multiple Entity grants = union

  • No entitlement = no data

  • Deep hierarchy performance validated


Benefits Realized

This combined architecture and implementation delivers:

  • One conformed security dimension

  • One semantic model for all audiences

  • Strong auditability and governance

  • Predictable performance at scale

  • A future-proof template for new domains

Security moves from a tactical concern to a strategic platform capability.


Closing Thoughts

Entity-based Row-Level Security is not just a Power BI technique—it is a modeling discipline. By separating entitlements from facts, pre-computing hierarchies, and enforcing consistent patterns, organizations can scale analytics securely without sacrificing agility or performance.

This reference architecture and implementation template is ready for rollout, ready for reuse, and ready for governance.


Wednesday, October 29, 2025

How to Automate Excel Generation with Power BI and Power Automate

 A practical blueprint for building a secure, scalable, and high-performance automation pipeline — grounded in proven patterns and enterprise deployment practices.


🌐 Executive Summary

Many organizations need standardized Excel outputs built from curated analytics — used downstream for reporting, modeling, or controlled data entry (with validations and dropdowns).

The most effective way to achieve this combines:

  • Power BI – for governed data and user-driven initiation

  • Power Automate – for orchestration, transformation, and delivery

  • Excel templates & Office Scripts – for structure, performance, and consistent formatting

  • Solution-aware deployment & environment variables – for security, maintainability, and scale

This guide outlines key design patterns, then walks through a complete end-to-end architecture, covering implementation, deployment, and operational best practices.


🧩 Requirements Overview

A successful automation solution should:

  • Generate consistent, template-based Excel outputs with validation lists

  • Use curated datasets as the single source of truth

  • Offer a simple Power BI trigger for business users

  • Support environment separation (DEV, UAT, PROD) and least-privilege access

  • Include robust error handling, logging, and audit trails


🔄 Solution Patterns Compared

OptionDescriptionStrengthsTrade-offsBest For
Manual export & formattingExport from Power BI → format manually in ExcelQuick startError-prone, no scalabilityOne-off or ad-hoc needs
Excel connected to BI datasetExcel connects live to Power BIFamiliar UXRefresh complexity, limited governanceAnalyst-driven scenarios
Paginated reports to ExcelPower BI paginated exportsPixel-perfect outputLimited flexibility for templatesHighly formatted reports
Power Automate orchestration (✅ recommended)Power BI triggers a flow → Excel generated from template via Office ScriptsScalable, fast, governed, auditableRequires setup & solution managementEnterprise automation

Recommended Approach:
Power Automate orchestration with Excel templates and Office Scripts — offering governance, reusability, and enterprise-grade automation.


🏗️ High-Level Architecture

1. Power BI

  • Curated semantic model and dataset

  • Report visual (button) to trigger automation

  • Parameter passing (user selections)

2. Power Automate

  • Orchestrates query → transform → template copy → data insert → save → notify

  • Uses environment and flow variables for configuration

  • Connects to Power BI, SharePoint, OneDrive, Excel, and Outlook securely

3. Excel + Office Scripts

  • Template defines structure, tables, and validation rules

  • Scripts perform bulk data inserts and dropdown population

4. Storage & Distribution

  • Governed repositories for templates and outputs

  • Optional notifications to end users

5. Security & Governance

  • Role-based access and shared groups

  • Solution-aware deployment for version control and auditability


⚙️ End-to-End Solution Flow

  1. Trigger & Context
    User clicks the Power BI button → flow receives parameters (validated and sanitized).

  2. Data Retrieval
    Flow queries the dataset and parses results into a normalized array.

  3. Template Copy
    A standard Excel template is duplicated into an output location with runtime variables (e.g., worksheet/table names).

  4. Bulk Data Insert (Office Scripts)
    Script inserts data in bulk and populates validation lists — no row-by-row actions.

  5. Output & Notification
    File saved to governed output folder → notification sent with metadata and log ID.


📊 Power BI Development (Generic)

  • Provide unified access via an App workspace

  • Build on secure semantic model through gateway

  • Configure trigger visuals (buttons)

  • Pass selected parameters to Power Automate via JSON payload


⚡ Power Automate Development (Generic)

Receive Context

Bind Power BI parameters reliably using trigger payload.

Prepare Data Array

  • Query dataset

  • Parse JSON → strongly typed records

  • Normalize data for script consumption

Template Handling

  • Copy from governed folder per run

  • Keep templates decoupled from scripts

Office Scripts

  • Script A: Insert bulk data

  • Script B: Populate validation lists

Performance

  • Replace row-by-row writes with bulk operations

  • Reduce connector calls with grouped actions

Error Handling & Logging

  • Implement try/catch blocks

  • Record timestamps, record counts, correlation IDs

  • Send actionable notifications


🧠 Solution-Aware & Environment-Aware Design

  • Environment Variables: Centralize all environment-specific values (URLs, folder paths, dataset IDs).

  • Connection References: Standardize connectors across Power BI, SharePoint, Excel, and email.

  • Separation of Concerns:

    • Configuration → environment variables

    • Logic → flows & scripts

    • Integration → connection references

  • Promotion Model:
    Package and promote solutions across environments — no code changes, only configuration updates.


🧱 Deployment Blueprint

Always update assets in place — don’t delete and recreate — to preserve references and IDs.

  1. Source Control
    Store reports, templates, scripts, and flows with clear versioning.

  2. Templates
    Deploy to governed “Template” folders by environment.

  3. Office Scripts
    Upload to designated folders; update in place.

  4. Flows (Solutions)
    Promote managed solutions through DEV → UAT → PROD.

  5. Power BI Reports
    Update parameters, republish, and rebind automation visuals to correct flows.

  6. Dynamic Mapping
    Recreate Power BI visuals per environment and map to relevant flows.


🔐 Permissions & Governance

RoleResponsibilities
Business UsersRun reports, trigger flows, access outputs
Automation OwnersMaintain flows, templates, and scripts
Data OwnersManage datasets, measures, and quality
Platform AdminsControl environments, pipelines, and security

Least Privilege: Restrict write access to designated owners.
Temporary Elevation: Allow elevated rights only during configuration tasks.
Auditability: Track changes through version control and execution logs.


⚙️ Operational Excellence

  • Support both on-demand and scheduled runs

  • Apply retention policies to outputs and logs

  • Monitor performance metrics (duration, error rate, throughput)

  • Use telemetry for continuous improvement


✅ Best Practices Checklist

  • Keep transformations in the Power BI model — use flows only for orchestration

  • Parameterize Office Scripts, avoid hard-coding

  • Use environment variables for all external references

  • Prefer bulk array inserts over iterative Excel writes

  • Update assets in place to preserve bindings

  • Implement robust logging and notifications

  • Document runbooks and configuration procedures

  • Validate templates regularly with sample test runs


🧪 Minimal Viable Flow (Reference)

  1. Trigger from Power BI with user parameters

  2. Query dataset → retrieve records

  3. Parse JSON → normalized array

  4. Copy Excel template → prepare runtime context

  5. Run Script A → bulk data insert

  6. Run Script B → populate validation lists

  7. Save file → log execution → notify stakeholders


🏁 Conclusion

By combining Power BI, Power Automate, Excel templates, and Office Scripts, you can deliver a robust, scalable, and secure automation pipeline — transforming curated analytics into standardized, high-quality Excel outputs.

Through solution-aware design, environment variables, bulk operations, and disciplined deployment, this architecture ensures consistent performance, strong governance, and minimal manual intervention — ready to serve multiple business units without exposing environment-specific details.

Thursday, February 20, 2025

Comprehensive Security Solution for a Sample Power BI App Deployment

                                                                                                                       Check list of all posts

Assumptions of Deployment Architecture

  • The Power BI model and reports are located in the same workspace.
  • Reports utilize a shared semantic model.
  • All reports are published via a Power BI app for end users.

Solution Summary:

  1. Enforce Robust Security Controls – Implement both Row-Level Security (RLS) and report-level access restrictions.

  2. Streamline Model Management – Maintain a single shared semantic model with built-in security to reduce maintenance overhead while ensuring compliance.

  3. Ensure Strict Access Control – Guarantee that users can only access the data and reports they are authorized to view.


Detailed Requirements:

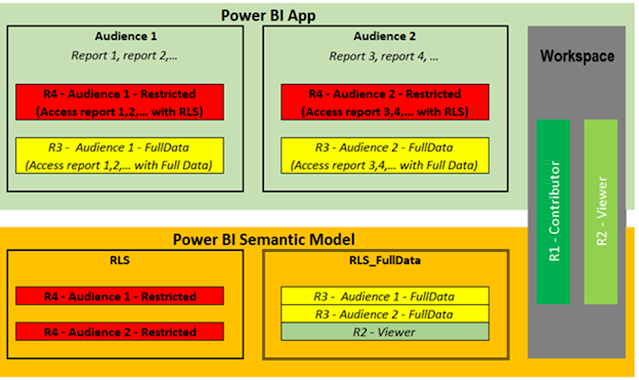
There are four roles with different access requirements. The diagram below illustrates the access structure.


Challenges & Analysis:

While roles 1, 2, and 4 have straightforward solutions, role 3 presents a unique challenge. Below are three potential approaches and their drawbacks:

Option 1: Assign Role 3 as "Contributors" in the Workspace

  • Issue: Contributors have access to all reports via the Power BI app, and restricting access at the report level is not possible.

  • Conclusion: This approach does not meet the requirement for selective report access.

Option 2: Use a Security Dimension to Control Access

  • Challenges:

    1. The security dimension could become excessively large, as it would need to store permissions for all users.

    2. Dynamic updates would be required to ensure new users and changing data permissions are accurately reflected.

    3. The security dimension might not cover all records due to incomplete mappings, potentially filtering out critical data.

  • Conclusion: This approach is impractical due to scalability and data completeness issues.

Option 3: Duplicate the Semantic Model

  • Process:

    • Create two versions of the semantic model: one with RLS and one without RLS.

    • Maintain separate reports pointing to each model, respectively.

    • Configure Power BI app audiences accordingly.

  • Challenges:

    • Requires maintaining duplicate models and reports.

    • Increases complexity in Power BI app configuration.

  • Conclusion: This approach introduces high maintenance overhead and redundancy.


Optimized Solution:

Rather than adopting the flawed approaches above, we propose an innovative RLS setup that does not impose restrictions. The key steps include:

  1. Define an RLS Role with Full Access:

    • The security filter is set to TRUE(), ensuring that assigned users can access all data without restriction.

  2. Use a Disconnected Security Dimension:

    • Applying TRUE() alone is insufficient because relationships between the security dimension and the main model may still filter data unexpectedly.

    • By using a disconnected security dimension, we prevent unintended filtering effects.

This approach achieves:

  • No need for a massive security dimension.

  • No need for duplicate models.

  • No need for duplicate reports.

  • Simplified Power BI app configuration.

With this methodology, along with the existing roles 1, 2, and 4, the final solution structure is illustrated below


Implementation Steps:

Create an RLS Role (Refer to the diagram below).


Create an RLS_FullData Role (Refer to the diagram below).


Assign SecurityGroups to Appropriate Roles
  • Define security groups based on role-based access needs
  • Extend security group assignments as necessary (Refer to the attached diagram).


This solution ensures scalable, maintainable, and efficient security management within Power BI, aligning with the business requirements for secure and streamlined report access.


Note 1:  “Apply security filter in both directions” ensures row-level security filters flow both ways across the relationship, which can be powerful but might complicate your security model.Turn on both-direction filters only when you need dimension tables to be filtered based on row-level security rules that originate in the fact table or in other scenarios that require the dimension table itself to be restricted by fact data.

Friday, July 26, 2024

Unlock the Full Potential of Power BI with Row-Level Security (RLS)

                                                                                                                         Check list of all posts

Objective

Using a single table to control all static and dynamic Row-Level Security (RLS) in Power BI has several advantages:

Centralized control: With a single table, you can centralize all your RLS rules and permissions in one place, which can make it easier to manage and maintain your data model. This can be particularly useful if you have a large number of users, groups, and data sets that need to be managed.

Improved efficiency: A single table can help to streamline the process of managing RLS permissions, as you only need to update a single table to make changes to the permissions. This can save time and reduce the risk of errors, particularly if you have a large number of rules or permissions to manage.

Simplified troubleshooting: With all your RLS rules and permissions in a single table, it can be easier to troubleshoot any issues or problems that may arise. You can use the table to quickly identify and fix any errors or inconsistencies in your RLS rules, which can help to ensure that your data model is accurate and up-to-date.

Overall, using a single table to control all static and dynamic RLS in Power BI can help to improve the efficiency, simplicity, and accuracy of your data model, and make it easier to manage and maintain your RLS rules and permissions.

We want to enhance our use of Power BI by consolidating all our Row-Level Security (RLS) requirements into a single role. Currently, we have to define static RLS and dynamic RLS separately, and we have to set up multiple roles for specific dimensions in static RLS. Additionally, we have different areas for each static RLS. To address this, we aim to combine all data into a single dataset and create a single role for all RLS to achieve the following goals:

1) Combine static and dynamic RLS, allowing users to access only their own data and the data they are allowed to see based on their role or group membership.

2) Create a static RLS for multiple dimensions, such as product and customer dimensions.

3) Create a single role for each dimension, such as multiple products.

This document will provide a solution that guides you through the process, from the database to the final reports.

Sample data setup (SQL server)
DROP TABLE IF EXISTS dbo.CYFact;
Go
CREATE TABLE dbo.CYFact(
UserID varchar(10) ,
Product varchar(10) ,
Customer varchar(10) ,
Sales varchar(10) 
)
Go
insert into dbo.CYFact values 
('U1','P1','C1',1),
('U1','P1','C2',2),
('U1','P2','C1',3),
('U1','P2','C2',4),
('U2','P1','C1',5),
('U2','P1','C2',6),
('U2','P2','C1',7),
('U2','P2','C2',8)
Go
DROP TABLE IF EXISTS dbo.CYRLS;
Go
CREATE TABLE dbo.CYRLS(
ID varchar(10) ,
Email varchar(100) ,
IsDynamicRLS varchar(10),
ProductStaticRLS varchar(10) ,
CustomerStaticRLS varchar(10) 
)
Go
insert into dbo.CYRLS values 
('U1','U1@Test.com','Yes','P1','C1'),
('U1','U1@Test.com','Yes','P2','C1'),
('U2','U2@Test.com','No','None','C1')
Go
DROP TABLE IF EXISTS dbo.CYUser;
Go
CREATE TABLE dbo.CYUser(
ID varchar(10),
Email varchar(100) ,
)
Go
insert into dbo.CYUser values 
('U1','U1@Test.com'),
('U2','U2@Test.com')

Go
DROP TABLE IF EXISTS dbo.CYProduct;
Go
CREATE TABLE dbo.CYProduct(
ID varchar(10))
Go
insert into dbo.CYProduct values 
('P1'),
('P2')
Go
DROP TABLE IF EXISTS dbo.CYCustomer;
Go
CREATE TABLE dbo.CYCustomer(
ID varchar(10))
Go
insert into dbo.CYCustomer values 
('C1'),
('C2')

Data Model
Assuming that there are only one fact and three dimensions with a typical star schema. Please note the RLS is a disconnected table with all dimensions and fact tables.


Security Logic
We use 3 sample records below to demonstrate all cases we try to achieve.

  • U1 supports dynamic RLS, meaning that U1 can only access his data to the Fact sales table.
  • U1 supports static RLS for the product dimension, with two products P1 and P2
  • U1 supports static RLS for the customer dimension, with one customer C1 only
  • U2 doesn't support dynamic RLS, meaning that U2 can access all data. For example, he can access U1 data.
  • U2 doesn't support static RLS for the product dimension, meaning that U2 can access all products.
  • U2 supports static RLS for the customer dimension, with one customer C1 only.
Role implementation

CYUser

VAR _DimRLS =
    CALCULATETABLE (
        VALUES ( 'CYRLS'[IsDynamicRLS] ),
        'CYRLS'[Email] = USERPRINCIPALNAME ()
    )
VAR _RLS =
    SWITCH (
        TRUE (),
        _DimRLS = "No", TRUE (),
        [Email] = USERPRINCIPALNAME (), TRUE (),
        FALSE ()
    )
RETURN
    _RLS

CYProduct

VAR _DimRLS =
    CONCATENATEX (
        CALCULATETABLE (
            VALUES ( 'CYRLS'[ProductStaticRLS] ),
            'CYRLS'[Email] = USERPRINCIPALNAME ()
        ),
        'CYRLS'[ProductStaticRLS]
    )
VAR _RLS =
    SWITCH (
        TRUE (),
        CONTAINSSTRING ( _DimRLS, "None" ), TRUE (),
        CONTAINSSTRING ( _DimRLS, [ID] ), TRUE (),
        FALSE ()
    )
RETURN
    _RLS

CYCustomer

VAR _DimRLS =
    CONCATENATEX (
        CALCULATETABLE (
            VALUES ( 'CYRLS'[CustomerStaticRLS] ),
            'CYRLS'[Email] = USERPRINCIPALNAME ()
        ),
        'CYRLS'[CustomerStaticRLS]
    )
VAR _RLS =
    SWITCH (
        TRUE (),
        CONTAINSSTRING ( _DimRLS, "None" ), TRUE (),
        CONTAINSSTRING ( _DimRLS, [ID] ), TRUE (),
        FALSE ()
    )
RETURN
    _RLS

Test result

No Security ( Admin )


U1: User 1 login


U2: User 2 login


Note 1: If a user is assigned to two roles for row-level security (RLS) in Power BI, they will have access to the data that is allowed by the rules associated with both of those roles. This means that the user will be able to see all of the data that is allowed by the rules for either of the two roles. However, we try to assign everyone to a single role, driven by the table defined.

Note 2:  If a user has no role assigned with row-level security (RLS) in Power BI, they will not be able to access the data in the dataset. This is because RLS is designed to restrict access to data based on the user's role, and a user who has no role will not have any access to the data.

Note 3: To give people full access to data in Power BI using row-level security (RLS), you can create a role with no rules, or you can create a rule that allows access to all rows of data.
To create a role with no rules, you can simply define the role in the Power BI service and assign users to it. This will allow those users to see all of the data in the dataset, regardless of any other roles they may be assigned to.
Another way to do it is to assign this user to the contributor for the workspace where the dataset resides.

Note 4 The key to understanding RLS is that we implement RLS on the Power dataset. So, first of all, we need to figure out the fundamental permissions to Power BI datasets, which is the write permission. If a user has written permission on a Power BI dataset, then RLS won’t apply for this user. Why? Because the user can edit permission for these roles. If the user doesn’t have permission to write the dataset, RLS is fully enforced, no matter where the user has access to this dataset, in the original workspace, or any apps and shared links.
 Who has write permission for a dataset?
The user has access to the same workspace of the Power BI dataset and has permission as
• Admin
• Member
• Contributor
Who has no write permission on the dataset?
There are three cases where people have no write permission:
1) Report is in the same workspace as dataset. The user has permission as Viewer only.
2) Report is in a different workspace than the dataset. Users can be assigned to any security group, however these users should have only read, or build permission to the dataset.
3) Reports are accessed by a shared links
4) Reports are accessed by an apps
The diagram below illustrates all cases below.


Note 5: The "apply security filters to both directions" option in Power BI Row-Level Security (RLS) is used to enforce security filters in both the filters and visuals panes of a report. This can be useful for ensuring that users only see data that they are authorized to see, regardless of how they interact with the report.
For example, consider a report that contains a visual showing sales data for different products and customers. You have set up RLS rules to limit access to certain products based on the user's role, but you want to ensure that users cannot see data for customers that they are not authorized to see, even if they try to manipulate the filters or visuals to see data for other customers. In this case, you could use the "apply security filters to both directions" option to enforce the security filters in both the filters and visuals panes of the report.  However, this solution might not be the best, as there are two problems: 1) when the transaction table is huge, then it will result in poor performance; 2)  You might want customers, even if you don't have sales with the context of filters.

Note 6: User group to setup permissions:
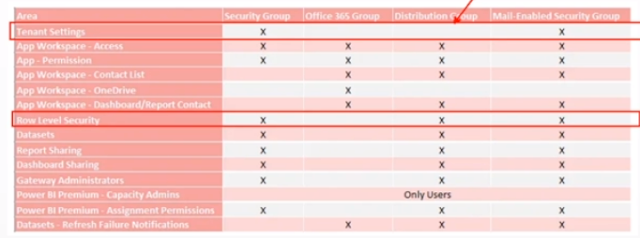


Note 7:  Why LOOKUPVALUE method is much more flexible than  USEPRINCIPALNAME: 
Dynamic security is a feature that allows you to change the level of access that users have to data in a Power BI report or dashboard at runtime. It allows you to specify which data a user can see based on their identity or role within an organization.
One way to implement dynamic security in Power BI is by using the LOOKUPVALUE function in combination with a security table. The security table is a table in your Power BI dataset that defines the level of access that different users or groups have to different data.
The LOOKUPVALUE function allows you to look up a value in a table based on a matching condition. In the context of dynamic security, you can use the LOOKUPVALUE function to look up the level of access that a user has to a particular data element in the security table, based on their user name or group membership.
For example, suppose you have a Power BI report that displays sales data for different products and customers. You can use the LOOKUPVALUE function to check the security table to see if the current user has access to the data for a particular product or customer. If the user has access, the LOOKUPVALUE function will return the value "Allow" and the user will be able to see the data. If the user does not have access, the LOOKUPVALUE function will return the value "Deny" and the user will not be able to see the data.
Using the LOOKUPVALUE function and a security table allows you to implement dynamic security in a flexible and scalable way. It allows you to control access to data at a granular level and to change the level of access that users have to data on the fly, without the need to update the report or dashboard.
By contrast, the USEPRINCIPALNAME function allows you to filter data based on the current user's login name. While this can be useful in some cases, it is less flexible than using a security table and the LOOKUPVALUE function, as it does not allow you to specify different levels of access or to easily change the level of access that users have to data.


Note 8:   Sample Implementation case of Row-Level Security (RLS)

Current Setup and Objective

Given that we have three different layers for Power BI implementation:

1. App Layer – Analytics

2. Dashboards/Reports Layer - SECURE_PROD

3. Semantic Model Layer - SECURE_Data

The Model is shared and located in a separate workspace (SECURE_Data). Dashboards/Reports are in a separate workspace (SECURE_PROD), where the shared Model is used. All dashboards/reports are organized in Power BI apps.

Ensure that when a specific employee logs in, they can only view their assignments for planned and actual data, while all other dashboards should not be impacted.

 Analysis

Implementing RLS can effectively resolve this visibility issue. The challenge lies in deciding whether to utilize a consolidated or separate model.

Separated Model Strategy

Advantages:

- Ease of Implementation: Implementing RLS on a separate model does not impact the central Model.

- Standardized Process: The implementation process is standardized, making it straightforward.

- Maintenance Simplicity: The separate model is easier to maintain due to its independence.

Disadvantages:

- Dual Maintenance Required: Any changes requiring updates in both models increase maintenance effort.

- Complex Separation: Defining a clear boundary between models is challenging due to many involved parameters.

- Dashboard Transition: Employees need to switch to the new model, potentially necessitating adjustments to the overview pages, which could become a considerable risk to implement.

Consolidated Model Strategy

Adding security to the data model will impact all dashboards, which is not desirable. The solution is to somehow enhance the current model by leveraging an “Inactive Relationship” for RLS, which should affect only dashboards that need to have RLS, and leave other dashboards unchanged.


Advantages:

- Single Model Management: Maintains a single model, avoiding duplicated efforts and simplifying management.

- Seamless Integration: All existing parameters and functions remain effective without needing alterations.

- Unified Dashboard Access: The employee dashboard points to the same model, ensuring consistency.

Disadvantages:

- Dashboard Adjustments Needed: Modifications to dashboard measures are required to activate the RLS features.

Implementation Details

1. The model includes an inactive relationship, which is currently used only for presentation purposes and is not operational in any DAX formulas. Also, `NetworkLoginName` is used for consistency.

2. The role  for a specific AD group has been configured for data viewing permissions.

3. DAX solutions have been implemented. Note that the functions `USERELATIONSHIP` and `CROSSFILTER` are not yielding the expected results.


MeasureX (RLS) =
VAR Email =
    
SELECTEDVALUE ( Users[Email] )
RETURN
    
IF (
        
ISBLANK ( Email ),
        [MeasureX],
        
CALCULATE (
            [MeasureX],
            'DimensionX'[Email] = 
Email
        
)
    
)


Deployment Details - Adding a Person or Group to RLS

 To add a person or a group to the RLS, you need to add this security to four different places:

On the Power BI app side ( at the audience level) .

On the dashboard/report side ( at the report level, not the workspace level, as you don't want people to access the report workspace)

On the semantic model ( at the model level, not the workspace level, as you don't want people to access the report workspace)

On the RLS security setting.

If a user has access to the dataset with Build, Share, or Reshare permissions but does not have Write access, you also need to add the user to the Security settings for the semantic model. However, if the user has Write access to the dataset, then it is not necessary to add them to the Security settings for the semantic model. Typically, we apply the first case.