Showing posts with label 5.4. Lists/Crosstabs/Charts/Maps. Show all posts

Saturday, December 13, 2014

How to "Amplify" changes with stacked chart

Context
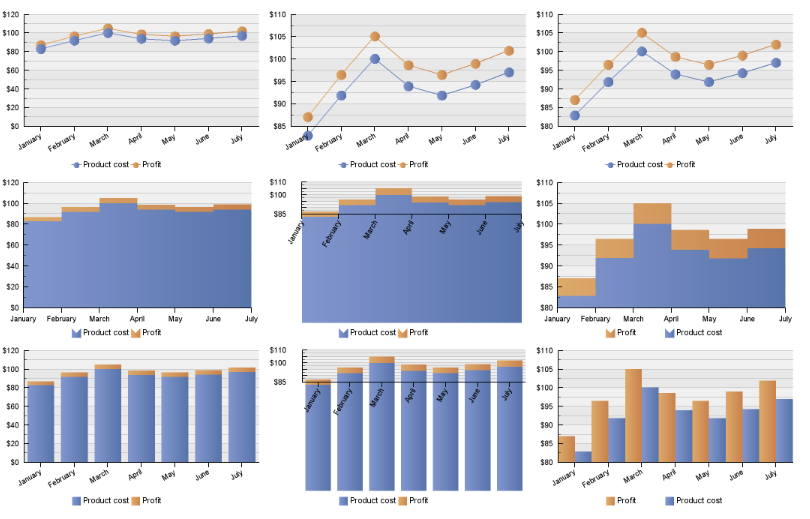
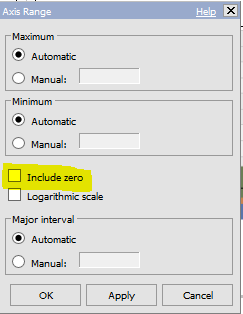
Known that it is easy to enhance the difference with clustered chart by choosing option not include zero. However, this option becomes very challenge for stacked charts. The middle charts below are with option “not include zero”, which is very difficult to use. Charts on the right side are requested.


Solution
The solution is to turn stacked chart to clustered chart.


  1. Uncheck option include zero

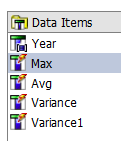
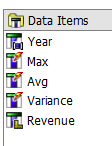
  1. Create new column to add both measure together to behave like second measure
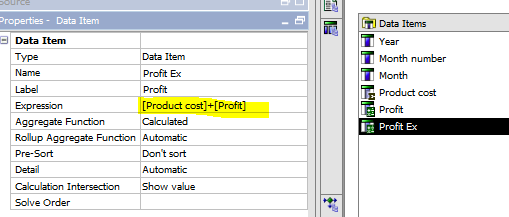
  1. Replace old profit with new measure


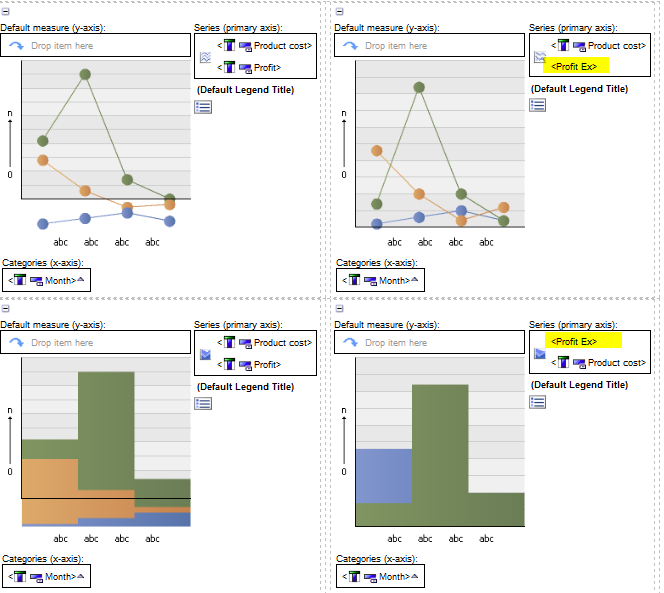
  1. Please note that Bar doesn’t work against this concept.


Saturday, February 8, 2014

How to assemble crosstab based on good prepared data

Sometimes, we can pre-aggregate data in data warehouse. There are manly two reasons of doing pre-aggregation: 1) the logic is complicated, and 2) report performance is very critical.  However, when bring such data into report; we can experience the problem, as we cannot use the default aggregation in Cognos. This document shares an idea to resolve this problem.
Data in data warehouse
Data is pre-calculated in database for current month, Previous month, YTD current Month and TYD previous month, which is reflected in framework manager as below
Product
CM-1
% budget
CM
% budget
CM-1
Sales
CM
Sales
CM-1
budget
CM
budget
YTD CM-1
% budget
YTD CM
% budget
YTD CM-1
Sales
YTD CM
Sales
YTD CM-1
budget
YTD CM
budget
Product A
91%
90%
91
90
101
100
101%
100%
191
190
201
200


Report
However, the requested report is supposed to display as below.

CM-1
CM
YTD CM-1
YTD CM

Product A
%budget
91%
90%
101%
100%

Sales
91
90
191
190

budget
101
100
201
200


Solution
There is no way that we can use the traditional crosstab aggregate to get report from framework manger. The solution is to list these data multiple times with cross space, and then hide all data that not needed to display.
Product
CM-1CM-1
% budget
CM
CM
% budget
CM-1
Sales
CM
Sales
CM-1
budget
CM
budget
YTD CM-1YTD CM-1
% budget
YTD CM
YTD CM
% budget
YTD CM-1
Sales
YTD CM
Sales
YTD CM-1
budget
YTD CM
budget

Product A
%budget
91%
90%
91
90
101
100
101%
100%
191
190
201
200

Sales
91%
90%
91
90
101
100
101%
100%
191
190
201
200

budget
91%
90%
91
90
101
100
101%
100%
191
190
201
200


Sample

A screenshot from a practical report is listed below

Sunday, January 5, 2014

How to make text appear on a discontinuous crosstab

Please see sample below, where text was put in discontinuous crosstab based on variance.. Please see report specification (version 10.2) for review


Query


Max: maximum ([Sales (analysis)].[Sales].[Revenue] within set  [Sales (analysis)].[Products].[Products].[Product line])


Avg: average([Sales (analysis)].[Sales].[Revenue] within set  [Sales (analysis)].[Products].[Products].[Product line])


Variance:  ([Max]-[Avg])/[Avg]


Variance 1:  Variance


There are two methods to get text appear on in discontinuous crosstab. But first of all, we should NOT use default measure in any query items. We should directly use measure expression.


  1. Add new query item for Cognos version before 10.2


Add Query Item Variance1, and then add it as a new Row, select intersection and mark define contents as Yes
Unlock sell, and Drag Layout calculation into cell, and defined as


case when ([Query1].[Variance1]>0.9)
then ('Variance > 0.9')
else ('Variance <= 0.9') end


  1. Add Cross space for Cognos version for 10.2


Instead of adding new Query Item, we can simply drag crosstab space there select intersection and mark define contents as Yes. Unlock sell, and Drag Layout calculation into cell, and defined as
case when ([Query1].[Variance]>0.9)
then ('Variance > 0.9')
else ('Variance <= 0.9') end

Sunday, December 22, 2013

How to make conditional style for a discontinuous crosstab

Please see sample below, where conditional style is NOT working for the first crosstab, but working for second crosstab. see report specification ( version 10.2) for review


What is the difference for such a simple crosstab?  First of all, this crosstab is discontinuous crosstab. It is a little different from normal crosstab, all cells are NOT shared the same default measure Revenue. Please note that same conditional style are defined for both crosstabs


While the query structures are same,


However, the query item definitions from both queries are different


Max:
Query 1: maximum (CurrentMeasure within set  [Sales (analysis)].[Products].[Products].[Product line])


Query 2: maximum ([Sales (analysis)].[Sales].[Revenue] within set  [Sales (analysis)].[Products].[Products].[Product line])


Avg
Query 1 and Query 2 are same:
average([Sales (analysis)].[Sales].[Revenue] within set  [Sales (analysis)].[Products].[Products].[Product line])


Variance
Query 1 and Query 2 are same:
([Max]-[Avg])/[Avg]


Conclusion: when making conditional style for discontinuous crosstabs, we should NOT use default measure in any query items. We should directly use measure expression. Please note that not using default measure may impair report performance.

Saturday, November 30, 2013

The Cognos Report Toolkit - Make crosstab with multiple measures as row

General note about The Cognos Report Toolkit
Report specification:  Relational, DMR, and Cube


Requirement
Below is a cross tab where multiple measures are aligned as row


Layout


Step 1: Create normal cross tab as below


Step 2: Drag planned revenue as nested node after Region

Step 3: Drag revenue as nested node under planned revenue after Region
Step 4: Drag gross profit as nested node under revenue after Region