Showing posts with label 5.3. Active Reports. Show all posts

Saturday, September 1, 2018

How to make KPI measure clickable in Cognos active reports

Requirement

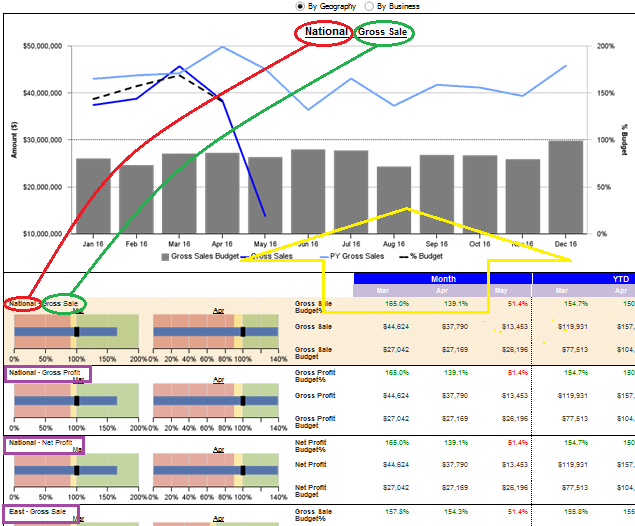
When clicking Revenue


When click Product cost


Analysis
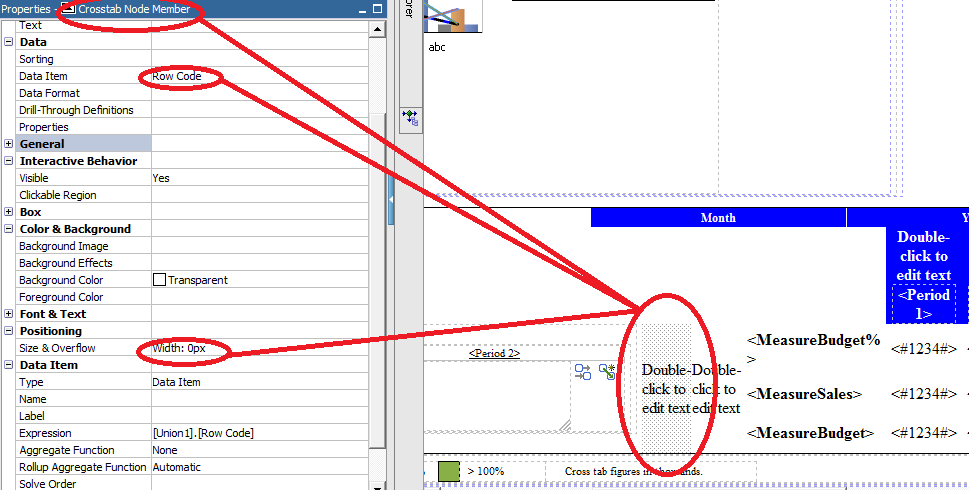
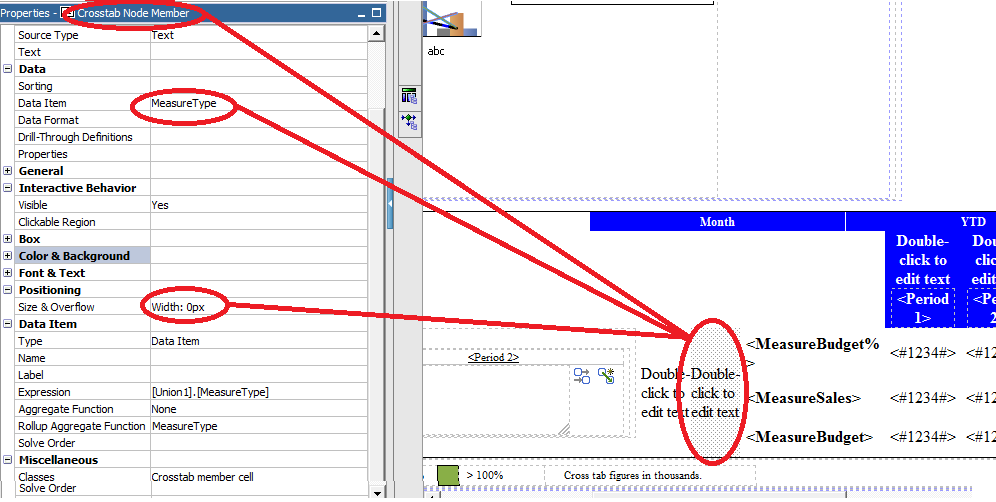
Use crosstab: As only active report variable can only specified by data item, it is difficult to find function to retrieve measure caption. In other word, when clicking value 914M, active variable should be specified as ‘Revenue’; when clicking value 547M, active variable should be specified as ‘Product cost’.  The only solution is to split it as multiple crosstab, each crosstab will specify one data item, such as  ‘Revenue’ or  ‘Product cost’.  Even with multiple crosstabs, the column title still cannot be share the same highlighted area, as column title can is not specified as click region.
Use List: It will have the same problem as crosstab. This approach won’t be very flexible, as crosstab give data more flexibility to display.
Use static repeat table: This solution provides the maximum display flexibility, but it still like crosstab and list to have their limitations.
Use static repeat table with singleton to achieve the needed functionality. Each static repeat table has only one cell. Each cell will contain normal table, and each table will have singleton. All query can be shared.

Implementation
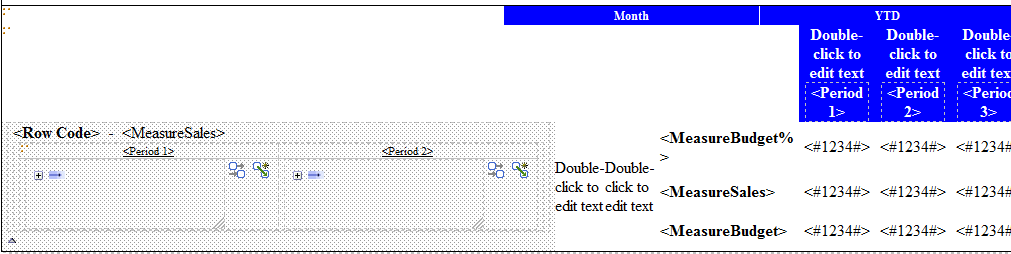
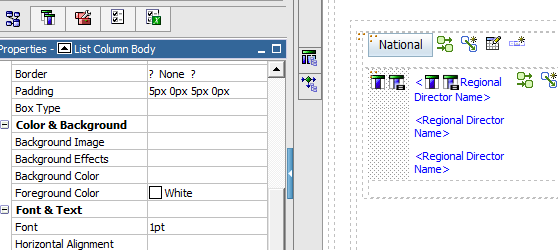
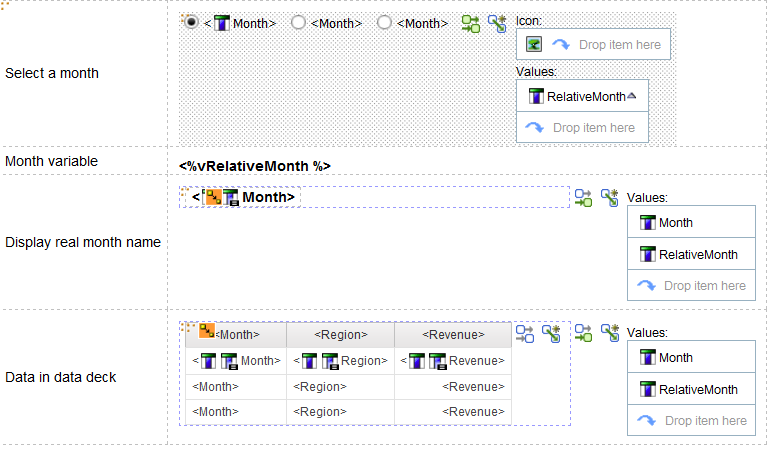
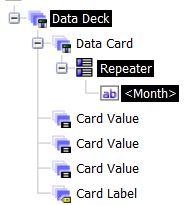
- Create a table with two rows, where the first one contains table with two static repeat table. Each static table has only one cell. the second row will contain a deck with two cards – page1 and Page2


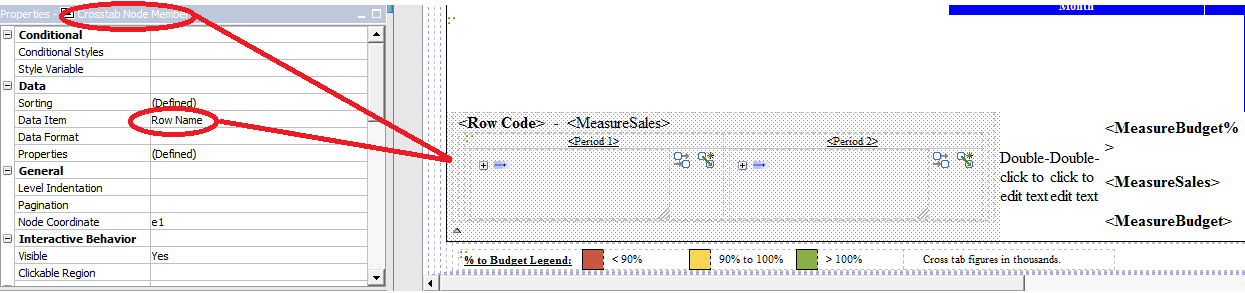
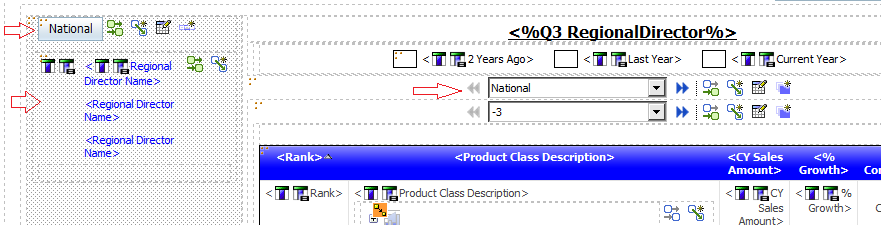
- To make the title with measure together, we need to put both value and title together. Please see page structure below.


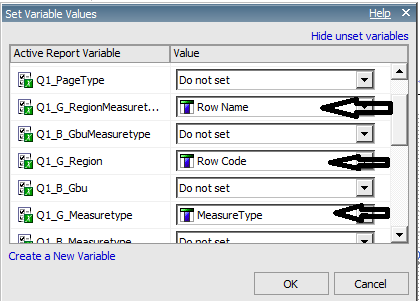
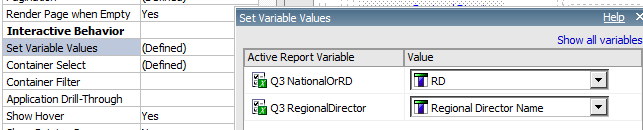
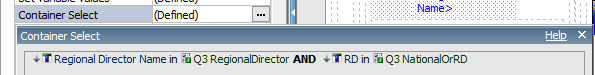
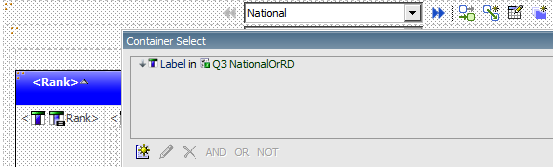
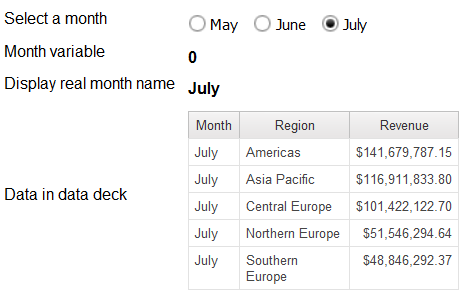
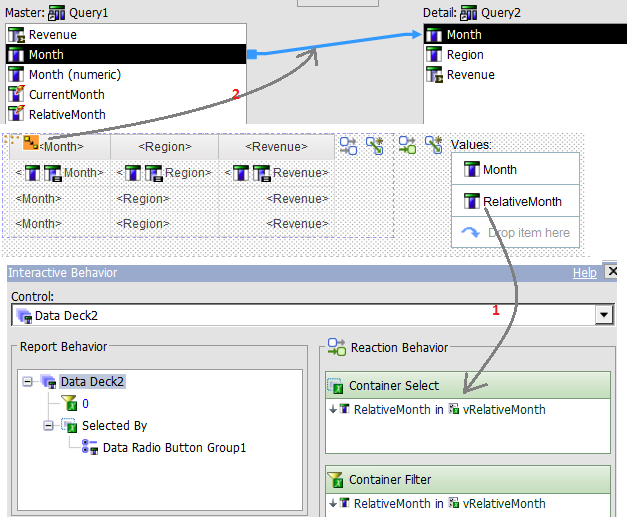
- Variable vPage will be specified by both active reportable table, and then pass it to deck to make it take in effect .

Sunday, June 5, 2016

How to pass two or more than one variables from crosstab in active report

Please see sample below. Chart is driven by crosstab below, when user click any cell in the area of national gross sale, the whole row will be highlighted, and the chart above will be changed accordingly.


Obviously, we need to pass two variables from crosstab. The one is region: national, east, west etc. the other is measure method: Gross sales, Gross profit, net profit.  We cannot pass combined variable, as active report has no functionality to parse the variable and split it into two, also it can be very trick in some cases. The safest way to publish three variables: 1) combined; 2) region and 3) method.
This document will use a few screenshot to demonstrate a solution to resolve this issue. The key is to make both region and method as crosstab node member behind the scene. Please note that make property in crosstab row does NOT work.
Make query as a unified query to serve crosstab, where there are three query items : Row name – combined; row code – region; measure type - method
 
Set all three variables in crosstab
By default, row name is crosstab node member, this is easy to understand.
The solution is to make both region and method as crosstab member as well, but make their width as 0, and therefore not show on crosstab. Because row name is the combination of region and method, or lowest granularity, each row will have a single region and single method. Add these two FAKED crosstab member is only serve the propose of passing these two variables. Please see screenshot below


Sunday, July 12, 2015

How to burst active report on iPAD

As known, we can deliver reports to iPAD by simply specifying send report to mobile recipients, as shown below


However, if you want to burst report to iPAD, then you need to have CAMID


Burst report


  1. Schedule report with burst


  1. Burst options with CAM ID


  1. Burst query


  1. CAM ID – can be found in Cognos connection


Note:  
As active report could run very long time and exceeds the execute limit. Therefore, we need to schedule report with different parameters to limit the execution time. The main problem is that we cannot schedule report with job. In other word, we cannot use the same report and then schedule it with different parameters. The current solution is to copy report into multiple locations and schedule it.

Sunday, February 1, 2015

How to use a single list to set more than one parameters in Active report performance

Sometimes, you don’t want to use default card in deck. In addition, you don’t want to use UNION to handle total, or default either. There are reasons why you don’t want to do these two ways.
  1. Default cards for nested data deck somehow don’t work, another reason is that somehow Cognos memory somehow doesn’t work properly when there are complicated desk structure with big data set. (one practical experience is about structure with Deck->Card->List->Mini Chart. The master –detail relationship between list and mini chart did not work, or work randomly.)
  2. To make default and total together, all queries at all levels must be changed, it could make query very complicated and dramatically impair the performance.
Is there third way to handle it?  The answer is YES. We can keep all the same queries, but add another level of deck to separate total and real parameters. We can call it Total or all others with two cards.
Card 1: Total
Card 2: all others
To get all others, you need to introduce the second parameter. The idea is to introduce the second column in list to indicate this is all others.


The idea is highlighted in sample below
A new column RD is added with all same value as ‘RD’


Add this column to list, but make it invisible. (Somehow the property doesn’t work, we need to add it physically to list)


Set two variables


Filter two variables


New added deck will take new variable Q3NationalOrRD


Saturday, November 15, 2014

How to setup a dynamic default value for an active report (Relational based)

Normally, it is requested to setup default value in active report. The default value in active reports must be static, or a specified string. The challenge here is how to transform a dynamic data into a static value for variable. For the sake of explanation, active report needs to display last three month based on available data. In Cognos sample database, the last available month is July 2013. It is requested to display last three months, which are May, June and July. From user point of view, report should not display Month – 2, Month -1 and Current Month, it should display real month name May, June and July.  Certainly, three months will be changed accordingly based on data availability.


This document is intended to demonstrate an idea to dynamically setup active report variable. The sample report specification, and active report .mht are attached for review (Cognos 10.2.0)


Report design:


Create a relative Month as variable with default value = 0
The key to turn dynamic month as static value is to create a relative month as the difference between Month – current Month.  In this case, the relative month is 0, -1, -2 with following map:
May   ←→ -2
June  ←→ -1
July ←→ 0
If we specify default value = 0, then July will be the default Month.
We can create a query as below to be used for data deck, and all active report items such as button group will use this query as well


The relative month becomes the value in report. The query is like follows
Current Month
maximum([Month (numeric)] for report)
RelativeMonth
[Month (numeric)] - [CurrentMonth]


Display real Month name
As variable vRelativeMonth is a number 0, -1 and -2, you cannot simply display a variable as normal case. We need to display a real month name as below
Same query is used for both data deck and repeater, and there is master detail relationship created based on Month itself. Variable value is passed in data deck via relative Month. Actually data deck performs the map between month name and relative month.


Keep all other queries based on real month for data containers
The approach above is very good, as we can define the real query with real month without consider relative month. Normally, there is a data deck with query with relative month; both real month and relative Month are listed for data deck. Make sure that variable is used to control relative month, then define master detail relationship with real month only

Saturday, November 1, 2014

How to improve Active report performance by using local classes

There are three kinds of active performance:
  1. The performance to generate active report, which is not so important for business users. (But it is imperative for developers.)
  2. The performance to load load Active Reports, .mht file to iPAD or PC. It is important for business users.
  3. The performance to use active reports, or how quick do active reports reacts on simply click from business users. This is extremely important for business users.


As known, Active reports render data decks at runtime for list and crosstab, which will impair the performance for large data set. Even worse ( version 10.1.1) when user left deck, it will take the same time as opening deck.  Sometime, it is absolutely necessary to have such data on deck. In this case, style becomes so important to apply. Normally, developer will simply use style for individual columns, headings, such make font bold, no board, or with different background colors. The performance becomes very slow.


The main solution is to apply local class, instead of using styles for each column heading, or data. (I have built a big dashboard for general manager. Its performance was dramatically improved by applying local class, which is unbelievable.)  below is steps in detail:


Step 1: create a css
<style>
.Title1{
font-weight: bold;
vertical-align: top;
text-align: center;
padding: 5px;
white-space: nowrap;
background-color: Blue;
color: White;
border: none;
}


.Data1{
vertical-align: top;
text-align: Right;
padding: 5px;
white-space: nowrap;
border: none;
}


.Data2{
vertical-align: top;
text-align: Left;
padding: 2px;
border: none;
}
</style>


Step 2: Add it to the front of page with HTML

Step 3: Navigate to Page Explorer > Classes, copy the code below to your clipboard, and then from the Edit menu, click Paste
<RSClipboardFragment version="2.0">
<classStyle name="Title1" label="Title1"/>
<classStyle name="Data1" label="Data1"/>
<classStyle name="Data2" label="Data2"/>
</RSClipboardFragment>


Step 4: Local class should appear on local class as below


Step 5: then go to all list or crosstab, apply heading, or intersection


Saturday, October 18, 2014

How to setup a dynamic default value for an active report (Dimensional based)

It is normally requested to setup default value in active report. The difference is that default value in active reports must be static, or a specified string. The challenge here is how to transform a dynamic data into a static value for variable. For the sake of explanation, active report needs to display last three month based on available data. In Cognos sample database, the last available month is July 2013. It is requested to display last three months, which are May 2013, June 2013 and July 2013. From user point of view, report should not display Month – 2, Month -1 and Current Month, it should display real month name May 2013, June 2013 and July 2013.  Certainly, three months will be changed accordingly based on data availability.


This document is intended to demonstrate an idea to dynamically setup variable. The report specification, and active report .mht are attached for review (Cognos 10.2.0). The main challenge of dimensional package is how to get relative month number, as there is no MDX function that can calculate the difference between different periods.  


Report design:


Create a relative Month as variable with default value = 0
The key to turn dynamic month as static value is to create a relative month as the difference between Month – current Month.  In this case, the relative month is 0, -1, -2 with following map:
May 2013   ←→ -2
June 2013  ←→ -1
July  2013 ←→ 0
If we specify default value = 0, then July 2013 will be the default Month.
We can create a query as below to be used for data deck, and other active report items such as button group  


The relative month becomes the value in report. The query is like follows


Month
tail(filter(members([Sales (analysis)].[Time].[Time].[Month]),
tuple([Revenue], currentMember([Sales (analysis)].[Time].[Time]))
is not null), 3)
MonthNumber
cast(substring(caption([Month]),char_length (caption([Month]))-4,5),integer) * 10 + [Month (numeric)]
Current Month
maximum([Month (numeric)] for report)
RelativeMonth
[MonthNumber] - [CurrentMonth]


Display real Month name
As variable vRelativeMonth is a number 0, -1 and -2, you cannot simply display a variable as normal case. We need to display a real month name as below
Same query is used for both data deck and repeater, and there is master detail relationship created based on Month itself. Variable value is passed in data deck via relative Month. Actually data deck performs the map between month name and relative month.


Keep all other queries based on real month for data containers
The approach above is very good, as we can define the real query with real month without consider relative month. Normally, there is a data deck with query with relative month; both real month and relative Month are listed for data deck. Make sure that variable is used to control relative month, then define master detail relationship with real month only

Saturday, October 11, 2014

How to make use of Cognos RAVE visualization tag cloud‬

Tag cloud is one of very useful RAVE visualization, which shows a list of words with their size and color intensity determined by a given measure. Based on my experience in real situation, it is not as simple as it seems to be in active report development. This document is intended to share two tips to make use of Tag cloud.

Control number of categories


It seems that Tag cloud can handle huge amount of data, and it show only top x categories. In reality, you need to control it. For example, to show retailers based on revenue as follows
You will get error below


If you clock No, then you will get graph with too many retailers, and user will see nothing, which is not useful at all.


Even Cognos provides way to specific data, the good solution is to limit data in query, such as select top 20. (expression topCount ([Sales (analysis)].[Retailers].[Retailers].[Retailer],20,[Revenue])). You will get very meaningful graph as below


Suppress tag cloud if there is no data
In real use case, there is no data available. Tag cloud shows as below


This is very annoyed to business users. Therefore we need to suppress tag cloud in case when there is no data. To make report flexible, normally we need to use repeater as container for tag cloud.