Control number of categories
It seems that Tag cloud can handle huge amount of data, and it show only top x categories. In reality, you need to control it. For example, to show retailers based on revenue as follows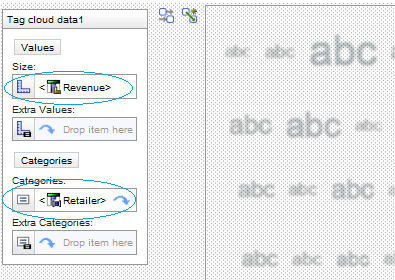
You will get error below
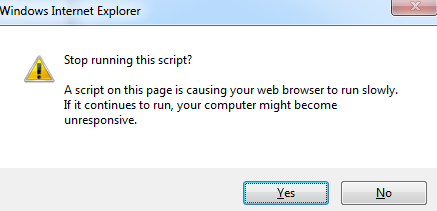
If you clock No, then you will get graph with too many retailers, and user will see nothing, which is not useful at all.
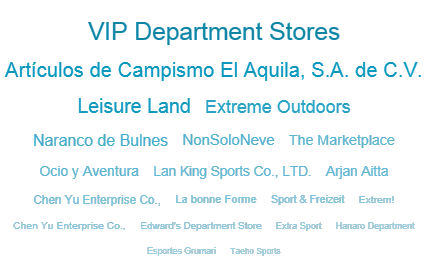
Even Cognos provides way to specific data, the good solution is to limit data in query, such as select top 20. (expression topCount ([Sales (analysis)].[Retailers].[Retailers].[Retailer],20,[Revenue])). You will get very meaningful graph as below
Suppress tag cloud if there is no data
In real use case, there is no data available. Tag cloud shows as below
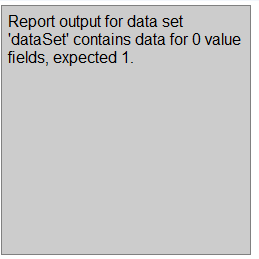
This is very annoyed to business users. Therefore we need to suppress tag cloud in case when there is no data. To make report flexible, normally we need to use repeater as container for tag cloud.

No comments:
Post a Comment