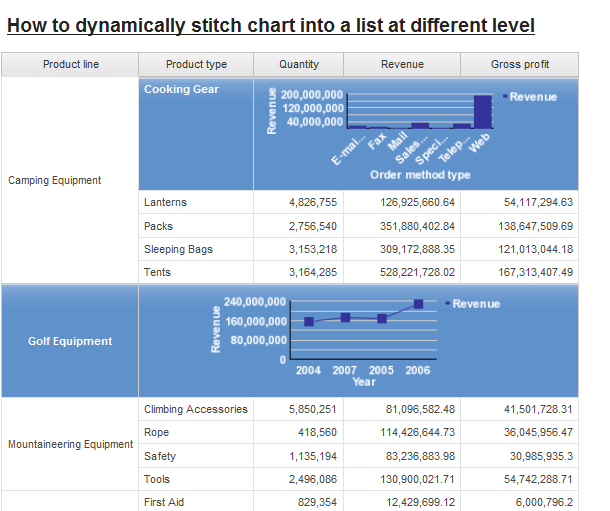
Request to present list data as graph for given product type or product line. For example,
- Present a bar chart for cooking Gear at product type level
- Present a line chart for golf equipment at product line level
While it is very simple to replace a column with chart with master detail relation, this requirement is very challenge to merge multiple columns at group and line level within list.
Solution
Please download report specification for referenceThe solution is to leverage auto summary line at different level, please see
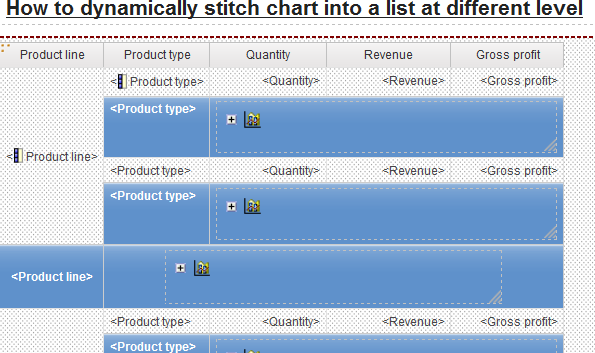
The main reason is that cells can be merged at auto summary line.
How to do it...
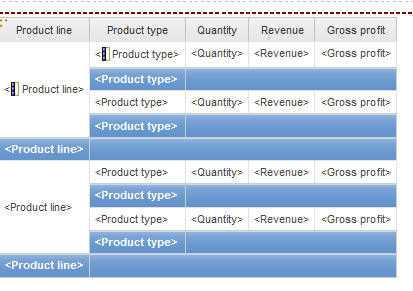
- Define two levels of summary, product line level and type level, and make appropriate format
- Define conditional variable to decide whether one should show, text or chart
- Text
- Summary at product line level
- Summary at product type level
Note
Add a new column or two columns into list, or called horizontal stitch doesn’t work, as list still consider a chart as a single column. Therefore, the merge cell is absolutely necessary to make stitch working.
Based on this concept, crosstab could provide even more flexibility as cells can be merged in both directions: horizontal and vertical. However, it could become very complicated design
No comments:
Post a Comment