
Context
General approach – 4 Tier Concept
Implementation
Database tier - Separate summary table and detail table – “vertical partition”
Database tier - Make fact table measure oriented – “horizontal partition”
Database tier – Make cumulative relative measure available
Framework tier - Maximize the benefit of “stitched query”
Report tier - Avoid performance trap when using shared sub query
Report tier - Enhance prompt reconciliation
Report tier – Minimized SQL performance
Report tier – Use the right approach for marker and baseline – cache Cognos parameter
Context
The purpose of the report performance tuning is to collect all experience to provide an approach of report performance tuningGeneral approach – 4 Tier Concept
As a generic guideline of Cognos performance tuning is too general to follow, it is proposed to have 4 tier concepts to do report performance tuning. The 4 Tiers are:- Business requirement Tier, such as to get rid of dynamic date range. This is most effective way to dramatically boost performance.
- Database tier, such as to build summary table or subset of fact table
- Framework manager tier, such as to use multi fact table with minimized SQL
- Report tier, such as to reduce queries
Implementation
Database tier - Separate summary table and detail table – “vertical partition”
There are two ways to get summary tables: 1) aggregate transaction measures without reeducation of number of dimensions; 2) reduce number of dimensions.Database tier - Make fact table measure oriented – “horizontal partition”
Separate fact table many measures into multiple sub fact table, where each sub fact table represent only a single measures. This approach could dramatically reduce the number of records for each fact table. In case when multiple measures are requested to put together, then stitched query can be used in report, which will dramatically enhance the performance.Database tier – Make cumulative relative measure available
Instead of calculating cumulative measures during the report generation, such as sales for previous month, sales for rolling three months, we can pre-calculate these cumulative measures as columns. This approach will enhance the performance, as report can simply take measure without any calculation.Framework tier - Maximize the benefit of “stitched query”
A stitch query uses multiple sub queries, on for each star, brought together by a full outer join on the common keys. This is one of very powerful solution in Cognos to get good performance for conformed dimension. The more conformed dimension, the better performance.Report tier - Avoid performance trap when using shared sub query
If there are not big amount of data, this problem is not clear. However, when data grows bigger, then report becomes extremely slow. One of reasons is to use shared sub query.
Shared query approach:
subquery ( A, B, C, D,E,F,G ) Qry for chart 1 ( A,B )
subquery ( A, B, C, D,E,F,G ) Qry for chart 2 ( C,D )
subquery ( A, B, C, D,E,F,G ) Qry for Crosstab 3 ( E,F,G )
Cognos engine will select all combinations of A,B,C,D,E,F,G, either to the server, or will be generated as subquery. This results in a huge amount of data either in Cognos local, or even in database side.
Consistent query approach:
subquery 1( A, B) Qry for chart 1 ( A,B )
subquery 2(C, D) Qry for chart 2 ( C,D )
subquery 3(E,F,G ) Qry for Crosstab 3 (E, F,G )
Cognos engine will select only requested combinations, this will dramatically improve the performance and Cognos server stability.
Please note that shared query for different data sections is perfect fine, as Cognos is smart enough to generate SQL based on each report section.
Report tier - Enhance prompt reconciliation
This article is to provide a solution to resolve prompt performance issue.
This is Journey to figure out this idea when you experiencing very slow prompt page.
- Initially, I though it is HTML rendering takes most of time.
- Implement prompt cache, however, no clear improvement, prompt cache is to save prompt query result.
- Then implement Tabbed prompt, clear improvement, but it was still slow.
- Then remove most of prompts, but It was slow, something must related with the main report.
- Remove most of parts of main report, then prompts becomes much quicker. This finding confirmed the thought, then touched prompt reconciliation concept.
The overall improvement by following three methods:
- Use prompt cache; improve about 10%
- Use tabbed prompt page; improve about 20%
- Enhance prompt reconciliation; improve about 70%
You can apply prompt cache and tabbed prompt page by following IBM good article http://www.ibm.com/developerworks/data/library/cognos/page164.html
Prompt reconciliation ensures the parameter definition matches the parameter usage. Parameters are defined in filters and calculations. The resulting parameters are used in prompts.
A parameter definition contains several key items
- Cardinality – The number of input values that can be supplied to the parameter
- Discreteness – Whether an input value defines a single value or a value range
- Optionality – Whether a parameter is required or optional in the context of the filter or calculation.
- Data type – The required data type that is expected in the context of the filter or calculation to match other referenced data items or constants. These types can be one of Numeric, Date, Time, Date, Time, Interval, String, or Member Unique Name (MUN).
As all charts or crosstabs use the same parameter, there is no need to validate all queries at all. Instead, we can specify only one query to be used. Below is the first cross tab used query. Specify Use for parameter Info as Yes,

While Specify Use for parameter Info as No for all other queries
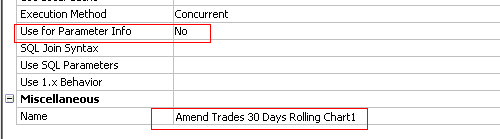
Another solution is to create a query which defines all parameters. Do not create any layout reference to this new query (i.e. no list, crosstab or chart uses this query). Set the query property Use for Parameter Info = True on this one query only. Now when this report is run only this one query is processed. As this query is not referenced in the layout, it will not actually be executed. Thus is solves the first prompt page performance issue without incurring any additional overhead.
Report tier – Minimized SQL performance
The section is intended to document the gradual process to achieve better Cognos metadata model with high performance and minimum impact on SEM database. (By the way, SEM database is a DB2 database) The main challenge is to calculate deadline bracket and Age bracket based on current time stamp.
Option 1 – calculate age in Cognos – local limited – more than 10 minutes
The idea is to build Cognos FM model without creating any database object(s) in SEM operation database. 1) Create AGE_BRACKET and DEADLINE_BRACKET in Framework manager
SQL script for AGE_BRACKET:
SELECT 'RECS' AS APPLICATION_CODE, 0 as AGE_KEY, 'UNKNOWN' as DESCRIPTION,-1000000000 as MIN_VALUE, -1000000000 as MAX_VALUE FROM SYSIBM.SYSDUMMY1
UNION
SELECT 'RECS', 1, 'Current',-999999999,1439 FROM SYSIBM.SYSDUMMY1
UNION
SELECT 'RECS', 2, '1 day',1440,2879 FROM SYSIBM.SYSDUMMY1
UNION
SELECT 'RECS', 3, '2 days',2880,4319 FROM SYSIBM.SYSDUMMY1
UNION
SELECT 'RECS', 4, '3 days',4320,5759 FROM SYSIBM.SYSDUMMY1
UNION
SELECT 'RECS', 5, '4 days',5760,7199 FROM SYSIBM.SYSDUMMY1
UNION
SELECT 'RECS', 6, '5-10 days',7200,14399 FROM SYSIBM.SYSDUMMY1
UNION
SELECT 'RECS', 7, '10+ days',14400,999999999 FROM SYSIBM.SYSDUMMY1
UNION
SELECT 'PAYMENTS', 0, 'UNKNOWN',-1000000000, -1000000000 FROM SYSIBM.SYSDUMMY1
UNION
SELECT 'PAYMENTS', 1, '0-1 hours',-999999999,59 FROM SYSIBM.SYSDUMMY1
UNION
SELECT 'PAYMENTS', 2, '1-2 hours',60,119 FROM SYSIBM.SYSDUMMY1
UNION
SELECT 'PAYMENTS', 3, '2-3 hours',120,179 FROM SYSIBM.SYSDUMMY1
UNION
SELECT 'PAYMENTS', 4, '3-4 hours',180,239 FROM SYSIBM.SYSDUMMY1
UNION
SELECT 'PAYMENTS', 5, '4-8 hours',240,479 FROM SYSIBM.SYSDUMMY1
UNION
SELECT 'PAYMENTS', 6, '8 hours+',480,1439 FROM SYSIBM.SYSDUMMY1
UNION
SELECT 'PAYMENTS', 7, '1 day +',1440,999999999 FROM SYSIBM.SYSDUMMY1
2) Calculate Age in framework manager
Age0: current_timestamp - [Database View].[TASK_INSTANCE].[START_DATE]
Age: extract(day,[Database View].[TASK_INSTANCE].[Age0] ) *24 * 60 + extract(hour,[Database View].[TASK_INSTANCE].[Age0] ) *60 + extract(minute,[Database View].[TASK_INSTANCE].[Age0] ) + 300
Because there is no native Cognos DB2 current time stamp function, the only way is to use Cognos current_timestamp and then calculate the time difference in minutes
3) Create relationship between TASK_INSTANCE and Age
( TASK_INSTANCE.Age between AGE_BRACKET.MIN_VALUE and AGE_BRACKET.MAX_VALUE ) and ( TASK_INSTANCE.APPLICATION_CODE = AGE_BRACKET.APPLICATION_CODE )
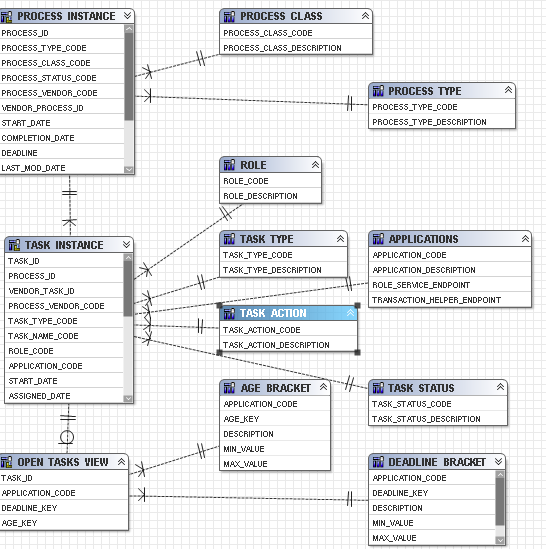
4) Database view diagram
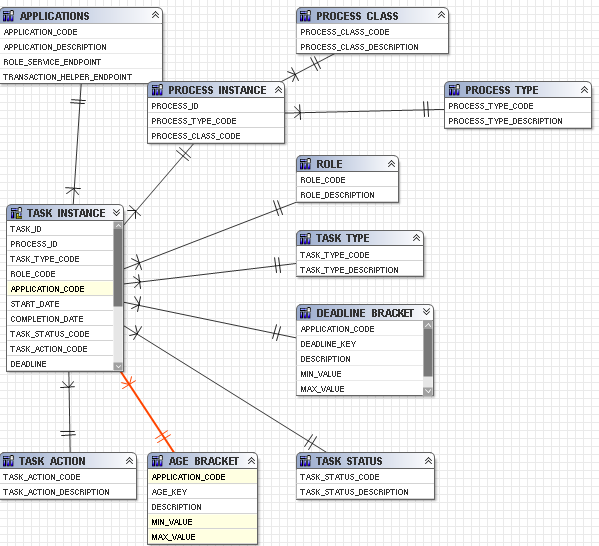
Because of using Cognos current_timestamp , the query processing must be specified as Limited Local.
When running report, you can see that SQL generated from Cognos retrieves the all open task records, and then moves it into Cogos application server, do the calculation and join in Cognos server. Based on the test database, it takes more than 10 minutes to generate the test STP report.
In addition, there could be calculation error, as the Cognos server and Database server may not have same current time stamp value.
Option 2 – calculate age in DB using native query – local limited – about 4 minutes
In order to resolve the problem of option 1, we want to move 1) the calculation of time difference and 2) bracket into database.1) Create two table AGE_BRACKET and DEADLINE_BRACKET in SEM database
2) Write a query Object OPEN TASKS in framework manager.
select
T.APPLICATION_CODE
,P.PROCESS_CLASS_CODE
,P.PROCESS_TYPE_CODE
,T.ROLE_CODE
,T.TASK_TYPE_CODE
,D.DEADLINE_KEY
,T.TASK_STATUS_CODE
,A.AGE_KEY
,DATE(T.START_DATE) as "Start Date"
,DATE(T.COMPLETION_DATE) as "Completion Date"
,T.TASK_ACTION_CODE
,1 as "Volume"
FROM SEM_DEV.TASK_INSTANCE T
INNER JOIN SEM_DEV.PROCESS_INSTANCE P ON (T.PROCESS_ID = P.PROCESS_ID)
inner JOIN SEM_DEV.DEADLINE_BRACKET D ON ( T.APPLICATION_CODE = D.APPLICATION_CODE and TIMESTAMPDIFF(4,CHAR(T.DEADLINE - CURRENT TIMESTAMP)) between D.MIN_VALUE and D.MAX_VALUE)
inner JOIN SEM_DEV.AGE_BRACKET A ON ( T.APPLICATION_CODE = A.APPLICATION_CODE and TIMESTAMPDIFF(4,CHAR(CURRENT TIMESTAMP - T.START_DATE)) between A.MIN_VALUE and A.MAX_VALUE)
where
TASK_STATUS_CODE NOT IN ('COMPLETE','CANCELLED')
4) Database view diagram
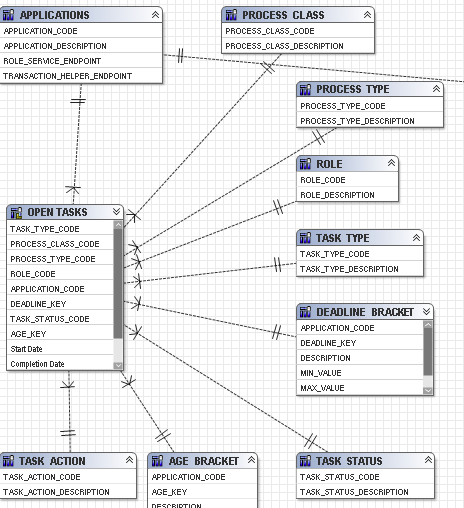
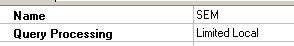
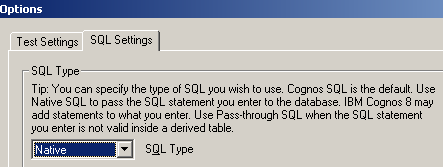
Because of using DB2 CURRENT TIMESTAMP, and TIMESTAMPDIFF , SQL has to be setting as Native query, and therefore, processing must be specified as Limited Local as well
When running report, you can see that SQL generated from Cognos retrieves the all open task records with the calculated bracket value, and then moves it into Cogos application server , do join in Cognos server. Based on the test database, it takes about 4 minutes to generate the test STP report.
The main problem is how to eliminate join process in cognos server , instead let database handle it
Option 3 – calculate age in DB using view – database limited – about 1 minute
In order to resolve the problem of option 2, we want to move 1) the calculation of time difference, 2) bracket and 3) Join (along with group by) into database.The solution is to turn the query into database view, which is the only change from option 2.
However, this change gives Cognos engine complete difference behavior as follows:
- SQL type: Cognos SQL
- Query processing: database only, and
- When running report, you can see that SQL generated from Cognos retrieves the final result from database, meaning that
- Not all open task records is moved to Cognos server
- SQL statement with group by, only results are moved back to Cognos server, this will dramatically reduce network traffic ( eliminate a big temp file generated in Cognos)
Based on the test database, it takes about 1 minute to generate the test STP report.
Option 4 – calculate age in DB using view – database only – minimized SQL – less than 1 minute
As the Age calculation is only applied for open task. There are many cases that this calculation is not required at all, listed below:
1) Trending report, we don’t need to have calculation, and we don’t need PROCESS_INSTANCE table at all. In this case, we want Cognos to generate SQL that only touch TASK_INSTANCE, without join with PROCESS_INSTANCE
2) Some STP charts and tables that don’t need to have calculation at all, and then we need to make the model only generate SQL without touch calculation
3) Only when a chart or table has Age, the calculation should be involved
This whole idea is demonstrated in Cognos as minimized SQL.
The main model changes of option 3 are:
- Change the view only handle Age and Deadline with TaskID
- 1:1 relationship left join between TASK_INSTANCE ( all tasks) and the view ( only for open task)
This new model become very flexible and satisfy minimized SQL concept. Based on the test database, it takes less about 1 minute to generate the test STP report.
The ideal solution is not to use the view at all, instead, to use query item that can directly pass to database. It looks like this is Cognos limitation. Once it is possible, we can do the implementation without have any impact on report.
Report tier – Use the right approach for marker and baseline – cache Cognos parameter
When using baseline and marker (mean and standard deviation) in Cognos Chart, your report is probably very slow. The real bottleneck is identified as baseline and marker related queries to calculate mean and stand deviation.
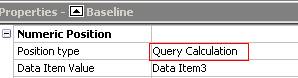
Cognos engine generates each query for each baseline, or marker. Why? Because we uses we use position type Query Calculation. This will trigger Cognos query engine to query database and do calculation. Each baseline and query have one corresponded query generated.
Cognos engine won’t generate queries, if you use layout calculation
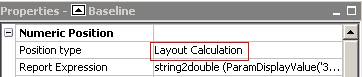
Now we need to pre-calculate Mean and Standard deviation and pass these values into report.
Approach described in detail
1) Create a repeatable table as the parent of four charts
2) Associate repeatable table to the MasterQuery, where mean and standard deviation for both 30 days (actually 260 days) and 13 Month are calculated as DataItem
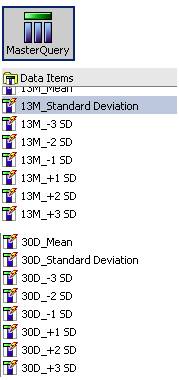
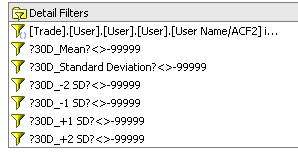
3) Add all dummy filters into chart query (30days Chart query)
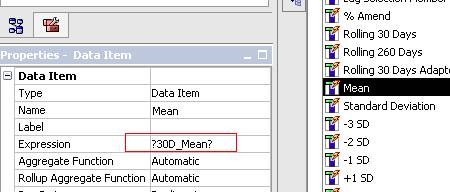
4) Change data item for mean standard deviation to equal to parameter (30days Chart query with Mean as sample below)
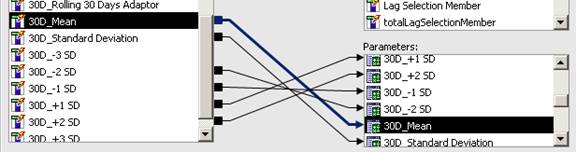
5) Define master detail relationship between master query and chart query
I’m not that much of a internet reader to be honest but your blogs really nice, keep it up!
ReplyDeleteI'll go ahead and bookmark your website to come back
later. Cheers
My site;
Thank you for this posting, Charles Yin. I applied part "Approach described in detail" and saw how it's improved :-)
ReplyDelete