We use the same chart to display volume of all queues.
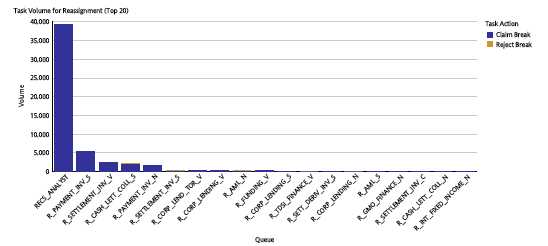
Normally, it generate chart to show top 20 bars as below
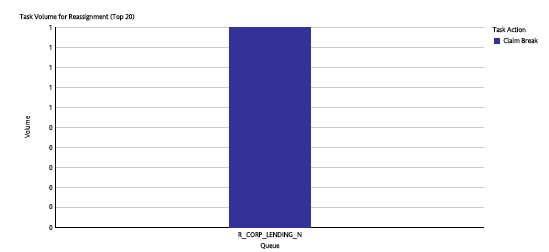
However, sometimes, it generate chart with only one bar as below
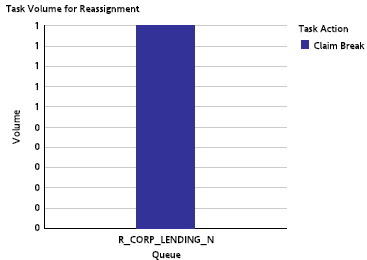
Business requires resizing it when there is less than 10 Bars, shown as below
Solution:
The solutions is to define conditional variable, when there is more than 10 bars, then show small chart, else when there is more than 10 bars, show big chart. Both big chart and small chart are defined with the shared query, and then use render variable to control which one to show.
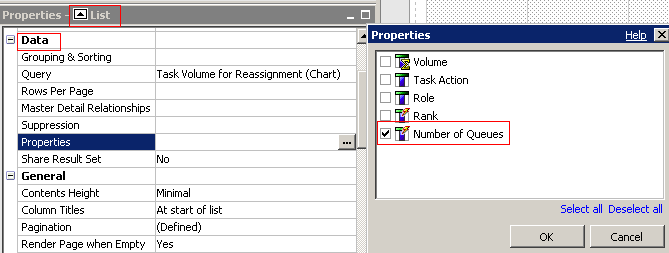
However, it doesn’t work, as it always gives you error “an error on or around the position '0'. The variable named '[Query name].[number of bars]' is invalid”. Actually, this is a generic issue for Cognos: An error is shown when there is a conditional variable based on a query item that is not displayed within the current container on the report layout. This is due to new functionality in Cognos 8 that optimises the query to eliminate unused data items from the resulting query SQL or MDX. To include a query item on the layout without displaying the object now requires that the query item be added to the properties of the container in the layout
Implementation:
List: Properties at List level
Cross tab: Properties at Crosstab member, not at Crosstab level
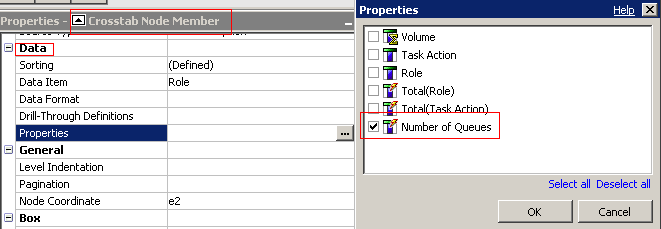
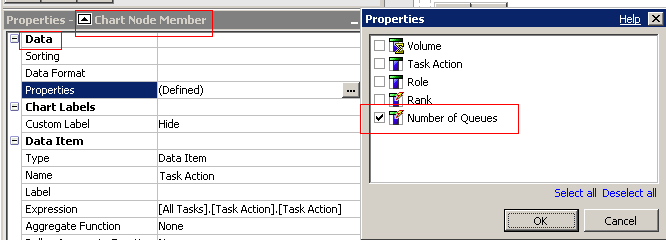
Chart: Properties at series, not at Chart level
Note: This is a generic concern when authoring Cognos report. The data item in query may not be retrieved at all, therefore, we need to pay special attention to these data items such as parameter pass through for drill through definition.
No comments:
Post a Comment