How to make bar chart conditional palette based on another measure
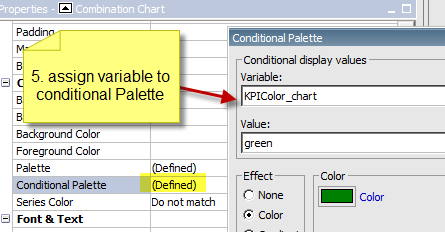
The bar chart (right) displays measure called DSOH, its color is based on another measure called KPI. While it is easy to have conditional palette based on its own measure, or other attribute, this case is NOT easy to have conditional palette based on other measure. The idea it to make second measure to the chart as Y2 and then hide it


Plz make sure that all the Images are visible
ReplyDeleteWhy "3. draw solid line" (in the markers)?
ReplyDelete