Directly pass variable values
Please download report specification and .mht file for review in detailActually, List, Crosstab and Chart become controls in active reports, which behave like a control that allows setting variable values and responding based on variable values. It is possible to directly pass variable to List, Crosstab and Chart. However, there are two main disadvantages:
- slide animation is not available like Deck
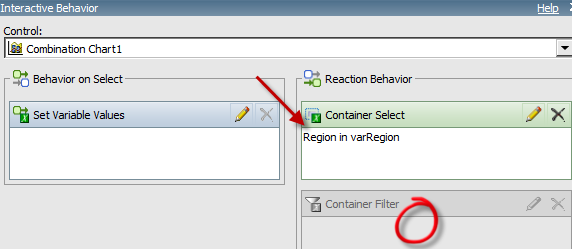
- Container filter is not available for chart; therefore, you can’t directly pass variable value for Chart.
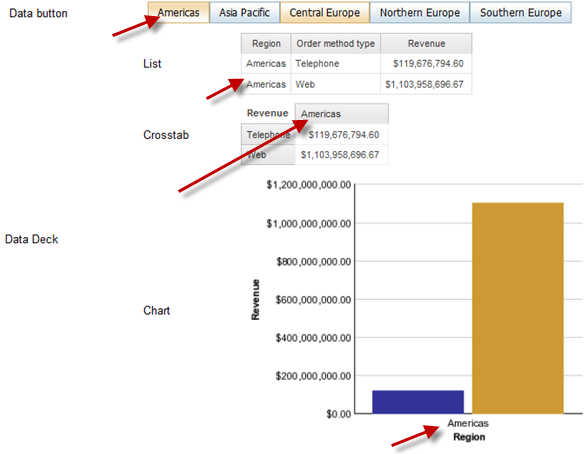
Please see attached screenshot below

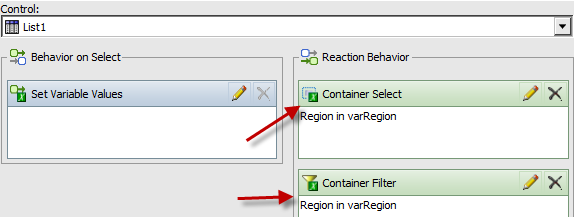
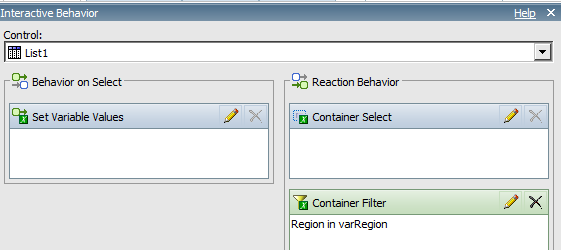
Specify container select and filter for List control:
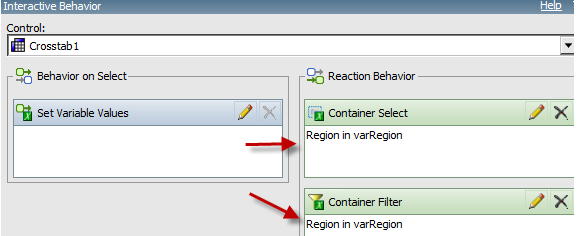
Specify container select and filter for Crosstab control:
Specify container select for chart Control: It is important to note that filer can’t be applied for chart.
Pass variable values using data deck with a single variable
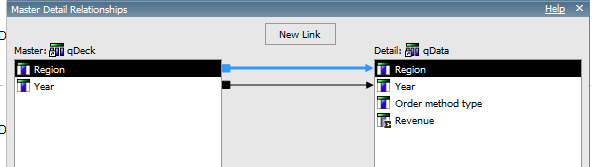
Please download report specification and .mht file for review in detailDefine a data deck and then put List, Crosstab and Chart into card. In this case, variable is passed from data button to data deck, then define a master detail relationship between Deck and all three components. This solution will provide slide animation, while the container filter is not needed. Please see attached screenshot below
Pass variable values using data deck with two variables
Please download report specification and mht file for review in detailIn case when List, Crosstab and Chart need two variables, it requests two columns in data deck to build master detail relationship. To get two columns in Data Deck, a data deck query is needed to have two columns from two queries. Please see attached screenshot below

Data deck query uses the cross product from both data button query and data radio query

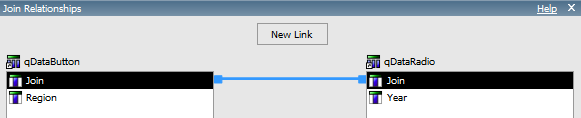
Then the master detail relationship is built based on join for both region and year
Pass variable values using data deck and direct pass (newly added)
Obviously, it is possible to pass variable via these two different methods. In this sample, region variable (varRegion) is a directly pass, while Year variable (varYear) is passed with data deck, or master detail. Please download mht and report specification for review in detail 
This solution bring two major advantages- Users still get interactive experience or animation with data deck. In this sample, users only care year change while region is specified somewhere else.
- The mht file size will be dramatically reduced, as the data deck results in much bigger size than direct pass
Implementation
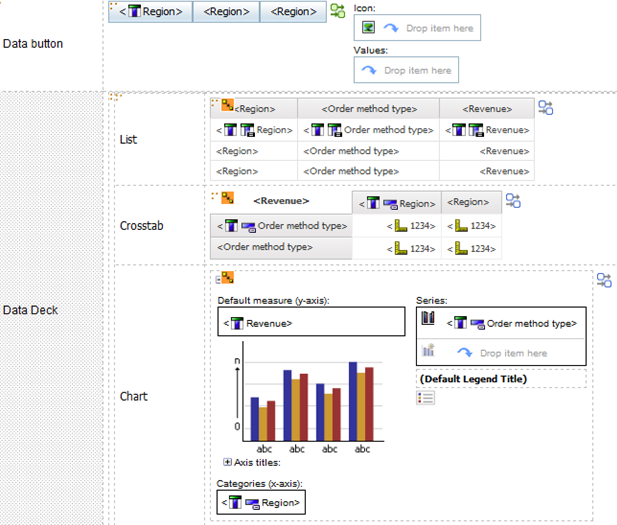
Report layout

Use data deck with master detail relationship
Use direct pass
Love the layout and explanation of this Charles, just getting to grips with AR reporting - Thanks
ReplyDeleteHi,
ReplyDeleteReally informative post.
Can u please provide the steps on how to filter a chart and a list on same deck using drop down list that passes user defined values (static values ).
This is a good concise explanation of how to filer objects.
ReplyDeleteThanks for this!