There are many ways to make report highly interactive:
- Active report: highly interactive, but it is disconnected report. Report won’t reflect data change in real time.
- Leverage current Cognos report with parameter, conditional block and drill through to make report as “web form”, where you can not only query data but also input data, please see old post (How to turn Cognos BI reports into “Web forms” without using JavaScript) for detail reference.
- Report with java script, which requires relative highly programming skills, also raise concern on Cognos upgrade, when Script may need to be retrofitted
Bring Jquery with Cognos provides another option to make report highly interactive with relative less effort. It can be used in following situations:
- It is connected report, or not active report, where you want report to reflect data change at real time.
- It s interactive report,or not PDF file, where user perform some action to do analysis.
- Report is requested to give user highly interactive experience, like active report with connected data source, including that user can input data like “web form”
A sample is built below to demonstrate the idea, please download report specification for review in detail
Also, you can check a few links below to get the overview of Jquery and application if requested
- http://jquery.com/
- Creating Dynamic IBM Cognos Reports with jQuery
Sample
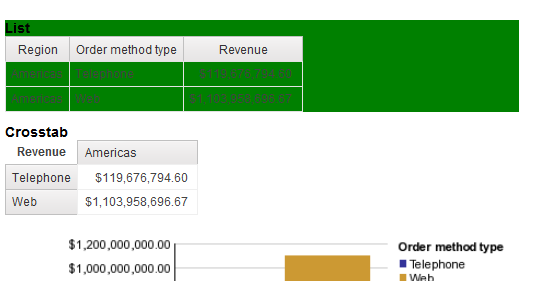
There are three areas on report: list, crosstab and chart. The area will be highlighted when hold mouse down in that areaList area
Crosstab area
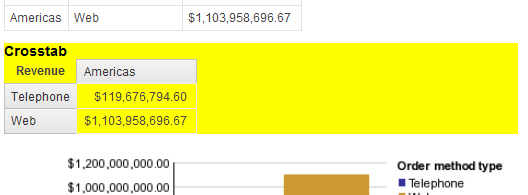
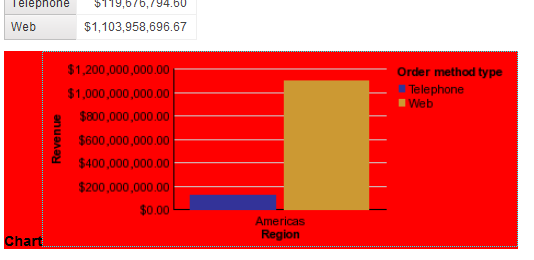
Chart area
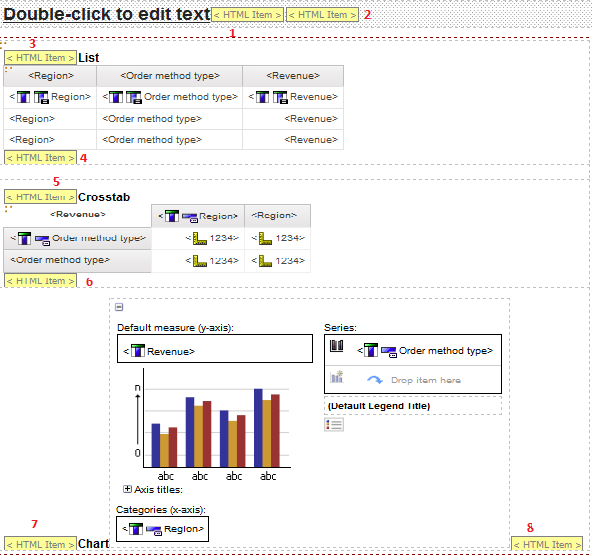
Implementation
You need to download Jquery library and copy it under Cognos web contents. Design view below in report studio.Layout
1
<script src="../scripting/jquery.js"></script>
2
<script>
$(document).ready(function(){
$("#Listblock").mousedown(function(){
$("#Listblock").css("background","green");
});
$("#Listblock").mouseup(function(){
$("#Listblock").css("background","white");
});
$("#Crossblock").mousedown(function(){
$("#Crossblock").css("background","yellow");
});
$("#Crossblock").mouseup(function(){
$("#Crossblock").css("background","white");
});
$("#Chartblock").mousedown(function(){
$("#Chartblock").css("background","red");
});
$("#Chartblock").mouseup(function(){
$("#Chartblock").css("background","white");
});
});
</script>
3
<div id="Listblock" >
4
</div>
5
<div id="Crossblock" >
6
</div>
7
<div id="Crossblock" >
8
</div>
Great article! Is there a way to have zooming charts using Jquery?
ReplyDeleteThanks,
Bob
Very very very useful blog for cognos guys...
ReplyDeleteReally very nice post,thank you for your info..
ReplyDeletecognos tm1 course