There are two ways to highlight areas, the one with Legacy chart engine, while the new one with Cognos 10 chart engine called Colored Regions
Legacy chart engine
Problem
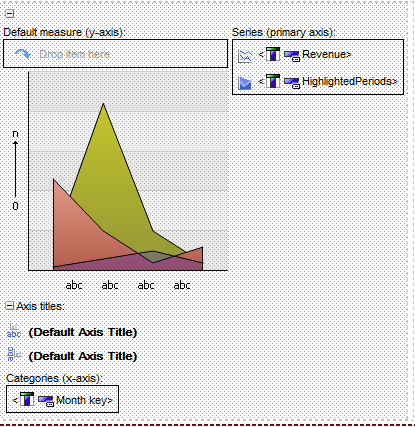
Please see screenshot below
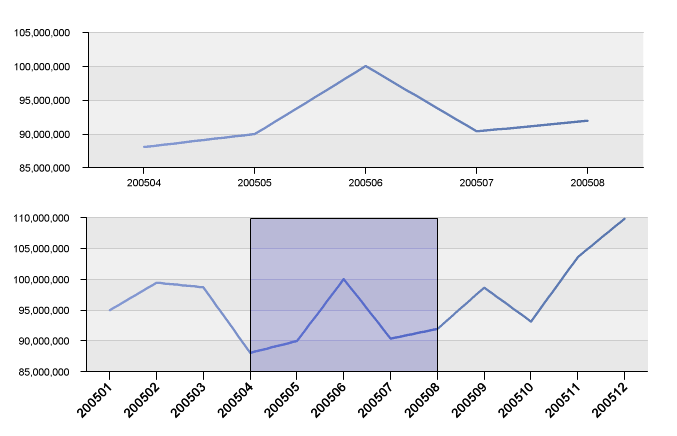
It is requested to highlight 200504 and 200508
Implementation
You can download report specification in detailAdd second series as highlightedPeriods into chart
Add second measure as highlightedPeriods into query item
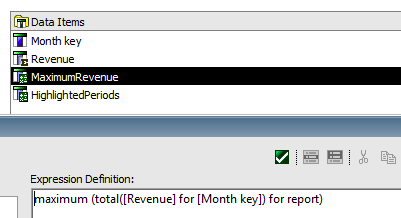
To get the maximum revenue for all periods, you need to use total for each period first.
maximum (total([Revenue] for [Month key]) for report)
then get measure
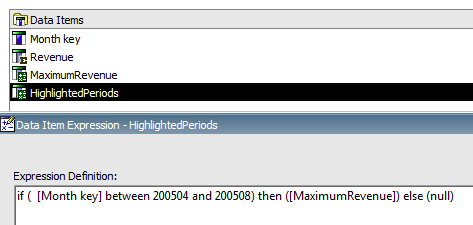
if ( [Month key] between 200504 and 200508) then ([MaximumRevenue]) else (null)
Colored Regions
You can define colored regions in the body of a chart. For example, you can divide the background of a scatter chart into quadrants and color each quadrant.You can add colored regions to bubble, bullet, combination, Pareto, progressive column, and scatter charts.


No comments:
Post a Comment