Please look at report below
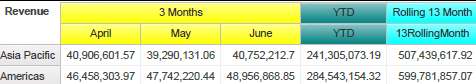
It is requested to sort by columns as well as rows based on YTD revenue
There are many ways to do it. Please check my old post How to handle relative time (relational model focused) for reference. The solution described below can be considered as another option. Please download report specification for detail review
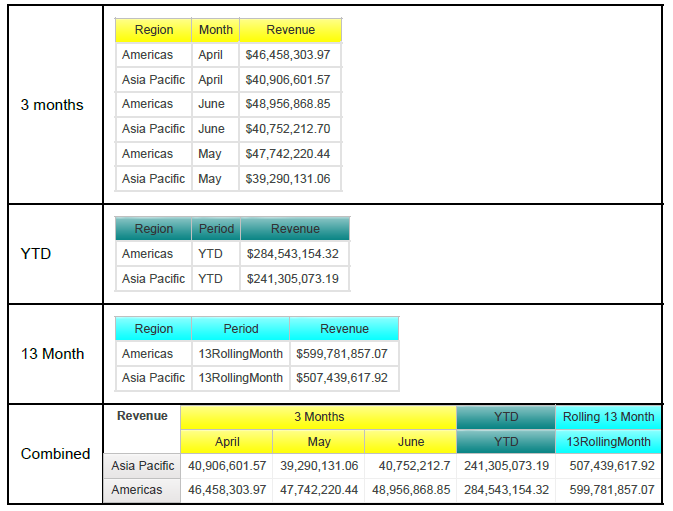
Union all data as a single query for crosstab
The idea is to make time period as X columns. We need to make sure that your query is union able, meaning that we need to cast data item as sample type

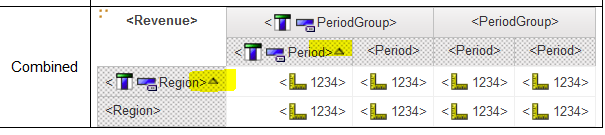
Define sort columns for both X and Y direction
To sort time period columns, or X direction, an XSort column is defined to give a number based on either period, or period group.To sort rows, or X direction, an YSort column is defined to get measure value

Notes
This solution is the appropriate one when- there is big data,
- columns are dynamically determined
No comments:
Post a Comment