It could a challenge task when creating a complicated chart. One of the best approaches is to consider chart as crosstab, which can really help you to build complicated chart. As known, crosstab is based on crosstab node member, while chart is based on chart node member; the data behavior is exactly same between crosstab and chart. The following sample demonstrated an idea to make chart and crosstab share the same query. Please download report specification (10.1.1) for detail reference.
Sample
The DMR sales package is used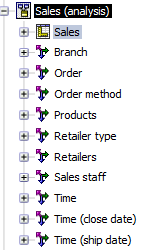
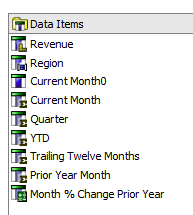
1. Create a query, where definition can be found in old post
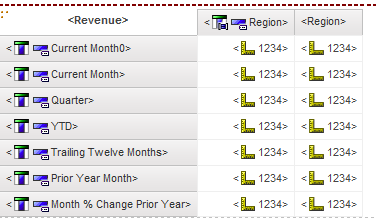
2. Create a crosstab
3. Now create a chart based on crosstab and use the same query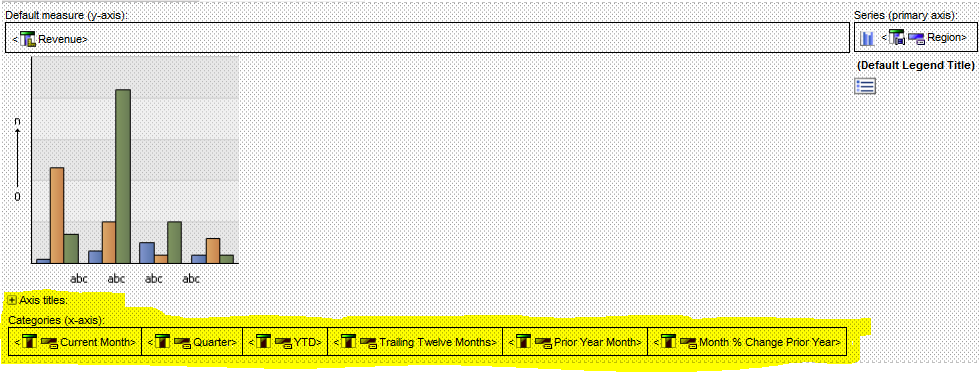
The key to focus is that you can add multiple periods easily with different period. Please be noted that these period can be considered as set union.
4. Run report
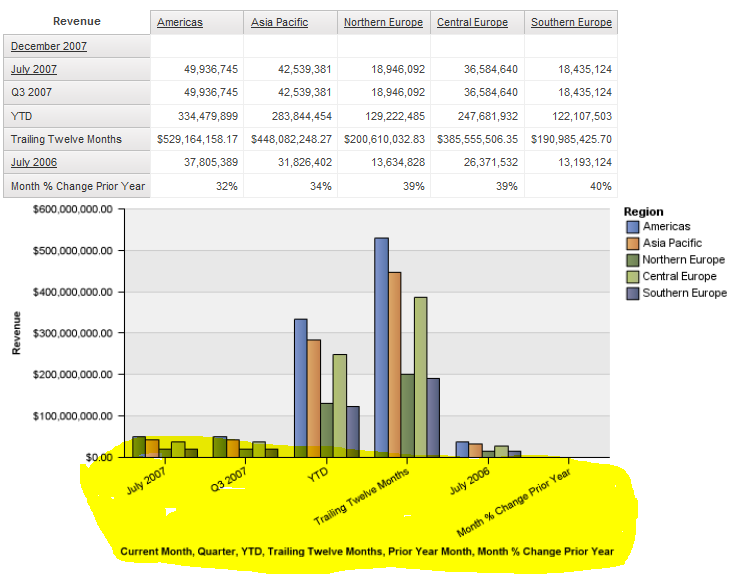
5. Chart and table is synchronized by drilling up and down, as they share the same query
No comments:
Post a Comment