How to compare Chart with Crosstab
Behind the scene, data from query engine is same for Crosstab and Chart. Therefore, when creating complicated chart, we can get data first from crosstab, then we can translate data from crosstab to chart. It can be nested or as discontinuous crosstab. This document gives you a sample to demonstrate the comparison between chart and crosstab. Please download report specification version 10.2 for review if needed.
Category in chart is corresponded to horizontal columns, including
- Nested crosstab: region and order method type, country and order method
- Discontinuous crosstab: region and then country
- Summary: summary of region
We can use the same way to drag data items to category in chart
Series in chart is corresponded to vertical columns, including
- Nested crosstab: product line and product type, Year product type
- Discontinuous crosstab: : product line and Year
We can use the same way to drag data items to Series in chart
The generated report is attached below.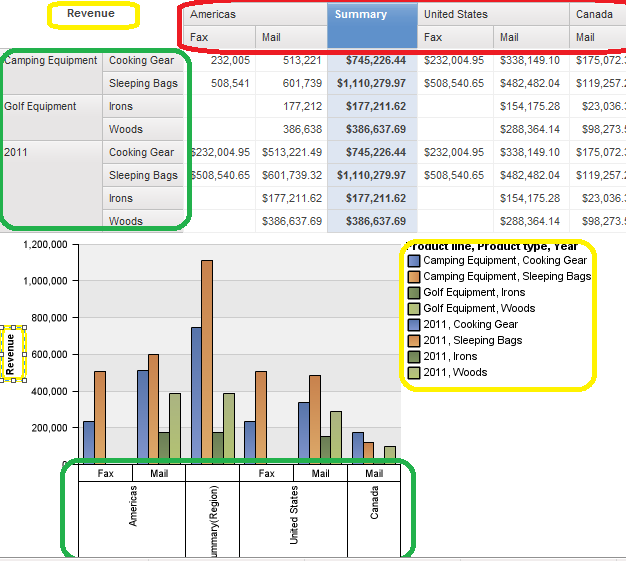
No comments:
Post a Comment