-
Summary
.
The crosstab performance issue of using DMR model for sparse data has been confirmed by IBM Cognos. The proposed solution is to use Dynamic Query Mode (DQM, s. The IBM Cognos 10 Dynamic Query Cookbook ), which is introduced in Cognos 10, and continuously enhanced in following versions. However, based on in-depth study, it is difficult to switch to this new technology. There are two reasons: 1) there will be a fair amount of migration effort for all current existing reports (s. IBM Cognos 10 Dynamic Query Mode Migration Scenarios). 2) Based on the feedbacks from Cognos community, the DQM is still too new and has bugs.
Introduction
DMR model is applied for all projects here. The data for KRI data is very sparse based business logic. We have experienced a very poor performance, particularly for crosstab in all studios. As data in fact table is very small, it is very difficult to even understand why Cognos engine delivers such a poor performance. Therefore, we have opened a ticket with IBM Cognos, and it has been confirmed as an issue from IBM Cognos. IBM has suggested using DQM. This document will record all findings for future reference.
Applicability
This document applies to DMR model with Cognos version 10.2.
Test result
A sample is created with 500 records of fact table, and 4 small dimensions D1, D2, D3 and D4. Reports based on relational generate the same data to Reports based on DMR. The test result is listed as follows
RS/QS
|
Cases
|
DMR Model using CQM*
|
DMR Model using DQM**
|
Relational Model
|
Report studio
|
1 nested crosstab
|
25 seconds
|
1second
|
1second
|
2 nested crosstab
|
>1600 seconds
|
1second
|
1second
| |
Query studio
|
1 nested crosstab
|
20 seconds
|
0.5 second
|
0.5 second
|
2 nested crosstab
|
>1600 seconds
|
0.5 second
|
0.5 second
|
* DQM – Dynamic Query Mode
**CQM - Compatible Query Mode
Suggestion
Switched to DQM mode, performance will be dramatically improved. Should we switch it? To switch to DQM model, we need to make all database JDBC connections, and migrate all reports.
The suggestion is NO, based on following two reasons:
1) There will be a fair amount of migration effort for all current existing reports (s. IBM Cognos 10 Dynamic Query Mode Migration Scenarios). In addition, there are some limitations as well. The following items are listed where DQM and handle differently
- Nonadjacent Nesting of Levels from the same Hierarchy
- Nesting Levels from the Same Hierarchy in a different Hierarchical order than Defined by the Metadata
- Same Hierarchy on Multiple Edges
- Using % of Each Column Total within IBM Cognos Analysis Studio
- Slicers Using Value Expressions
- Summary Filter with Invalid Scope
- NOT Operator in a Detail Filter
- Using the NestedSet Function outside an Analytic Summary
- Summary Filters in Master-Detail and Sectioned Crosstabs
- Page Sets and List Summary Filters Sharing the Same Query
- Tuple Function with Value Expressions
- Grouping on Attributes
- Comparing Different Data Types within Expressions
- Comparing Different Data Types within Expressions
- Vendor Specific Relational Functions in a DMR Report
- Non Consecutive Same Hierarchy Nesting in a List Report
2) Based on the feedbacks from Cognos community, the DQM is still too new and has bugs.
As the whole DQM concept is based on cache, it causes a lot of issues when you need to refresh cache to reflect your changes, both metadata and data itself.
Problem with DMR Model with CQM and solutions
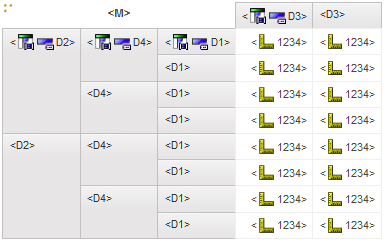
For relational crosstab, the hierarchy is built according to the nesting from the layout. If there is one level, then there will be one hierarchy with one level; if there are two levels, then there will be one hierarchy with two levels; if there are N levels, then there will be still one hierarchy with N levels. In other word, there will be always one hierarchy
For DMR crosstab, the hierarchy is built based on framework and layout.
- If there is one level, then there will be one hierarchy with one level;
- if there are two levels, and two levels are from different dimensions, then there will be two hierarchies with one level; if there are two levels, and two levels are from the same dimensions, then there will be one hierarchy with two levels;
- if there are N levels, and each level are from different dimensions, then there will be N hierarchies with one level; if there are N levels, and N levels are from the same dimensions, then there will be one hierarchy with N levels; in other work, all levels will be grouped by dimension, and then create number of hierarchies same as number of dimensions.
Obviously, the solution is to reduce:
- Number of nodes of each hierarchy
- Number of hierarchy
Relational package has much more advantage in term of performance, as it generate only one single hierarchy. However, DMR did provide other advantages, including natural support for drill up and down, easily handling of semi-additive measure, for example last value based on time. A few solutions are listed to improve performance.
Filter data
Applying filter can reduce the number of nodes for each hierarchy. There are at least two ways we can use:
1) Directly use mandatory filters, user will be forced to filter data.
2) Burst report, data will be indirectly filtered out for each report.
3) Apply row level data security, and data will be automatically filtered out based on user’s login.
Reduce number of hierarchies
As known, the number of hierarchy is actually the number of involved dimensions. The solution is to reduce number of dimensions. How? The answer is to combine them together. If we go extreme, we can make all dimensions into fact table, the whole model become one fact dimension and one fact table. All level will be considered as member properties. Therefore, there will be only single hierarchy, which in turn is very much like a relational package. In practise, we can combine some simple dimensions, such as two columns with ID and Name.
Add filters to get set
Another way to improve performance is not to use suppression on crosstab, to use filter MDX function. The filter function will return only valid set. Assume that data dimension is available from 1900 to 2020, which is typical data warehouse setting. If we don’t use filter function, then 120 year will be used in hierarchy. Applying filter years when sales is available, then only a few years will be used in hierarchy. The bottom-line is to eliminate members in hierarchy.
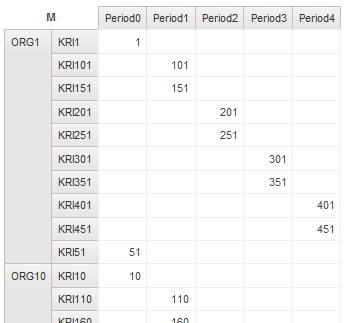
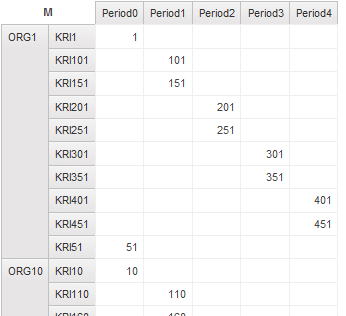
Sample
Database
There are 500 records in fact table, please attached spreadsheet (s. Appendix 1) for detail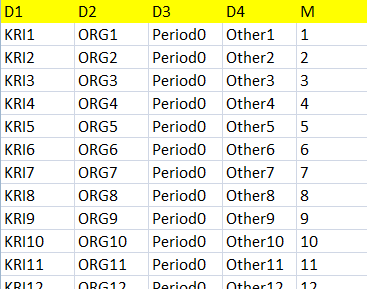
D1: KRI instance, 500 records, D1 is always needed to display from business point of view. Most of time, KRI cannot be aggregated
D2: Organization hierarchy, 50 records
D3: time dimension, period, 5 records
D4: Other dimension, 50 records
M: measure, or KRI value, 1 to 500 is assigned to KRI1 to KRI 500, respectively.
You can run DDL and DML(s. Appendix 2) to create data in SQL server database, better save in sample database
FM
Two models with same data and same structure are built for relational and DMR, please use attached FM for detail (s. Appendix 3)
Relational 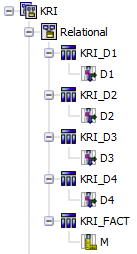
DMR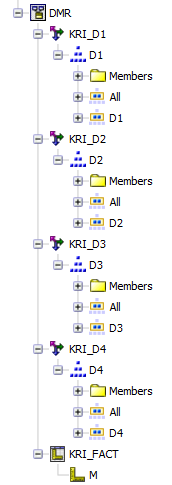
Reports
8 simple reports (s. Appendix 5) are created for test only,
Report studio
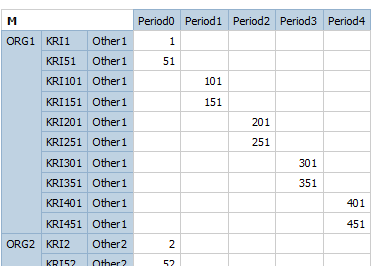
RS DMR crosstab - 1 nested – return 500 records (suppress row)
RS DMR crosstab - 2 nested – return 500 records (suppress row)
RS relational crosstab - 1 nested – return 500 records
RS relational crosstab - 2 nested – return 500 records
Query studio
QS DMR crosstab - 1 nested – return 500 records (suppress row)
QS DMR crosstab - 2 nested – return 500 records (suppress row)


QS Relational crosstab - 1 nested – return 500 records
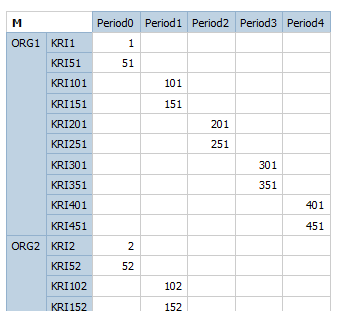
QS Relational crosstab - 2 nested – return 500 records
Analysis (1 nested report)
SQL statement sent to database
There is no any difference of SQL command sent to database between relational and DMR with CQM. While MDX statement will be generated for DMR with DQM. 1 nested crosstab as sample
DMR
select "KRI_D1"."D1" AS "D1key", "KRI_D2"."D2" AS "D2key", "KRI_D3"."D3" AS "D3key", sum("KRI_FACT"."M") AS "M"
from "GOSALES1020"."dbo"."KRI_D1" "KRI_D1", "GOSALES1020"."dbo"."KRI_D2" "KRI_D2", "GOSALES1020"."dbo"."KRI_D3" "KRI_D3", "GOSALES1020"."dbo"."KRI_FACT" "KRI_FACT"
where "KRI_D1"."D1" = "KRI_FACT"."D1" and "KRI_D2"."D2" = "KRI_FACT"."D2" and "KRI_D3"."D3" = "KRI_FACT"."D3"
group by "KRI_D1"."D1", "KRI_D2"."D2", "KRI_D3"."D3"
Relational
select "KRI_D2"."D2" AS "D2key", "KRI_D1"."D1" AS "D1key", "KRI_D3"."D3" AS "D3key", sum("KRI_FACT"."M") AS "M"
from "GOSALES1020"."dbo"."KRI_D2" "KRI_D2", "GOSALES1020"."dbo"."KRI_D1" "KRI_D1", "GOSALES1020"."dbo"."KRI_D3" "KRI_D3", "GOSALES1020"."dbo"."KRI_FACT" "KRI_FACT"
where "KRI_D2"."D2" = "KRI_FACT"."D2" and "KRI_D1"."D1" = "KRI_FACT"."D1" and "KRI_D3"."D3" = "KRI_FACT"."D3"
group by "KRI_D2"."D2", "KRI_D1"."D1", "KRI_D3"."D3"
DMC file
Temp file size between relation and DMR is almost same
Therefore, the only explanation is that Cognos engine handle crosstab differently between relational and DMR.
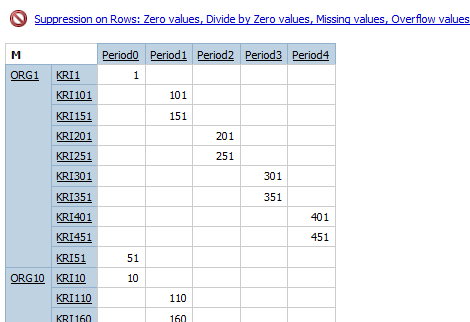
Number of records back to client without suppress
There is major difference (s. Appendix 5)
Relational: 500 records
DMR with CQM: 25,000 records
DMR with DQM: 500 records, as by default, null records will be supressed.
Please see attached spreadsheet
Appendices
No comments:
Post a Comment