-
Context
There is no problem to make measures flexible with dimensional data source, as we can define measure set by selecting measures, or measure member. We could apply the similar ideas (How to design Cognos interactive reports 01,02,03,04,05,06,07) to make measure flexible. However, there is no such concept with relational data source, therefore, we need to handle measure in different way by using style variable. This document will demonstrate the idea to make measure flexible. Please see attached report specification for review (version 10.2 with sample Package GoSales)
Sample
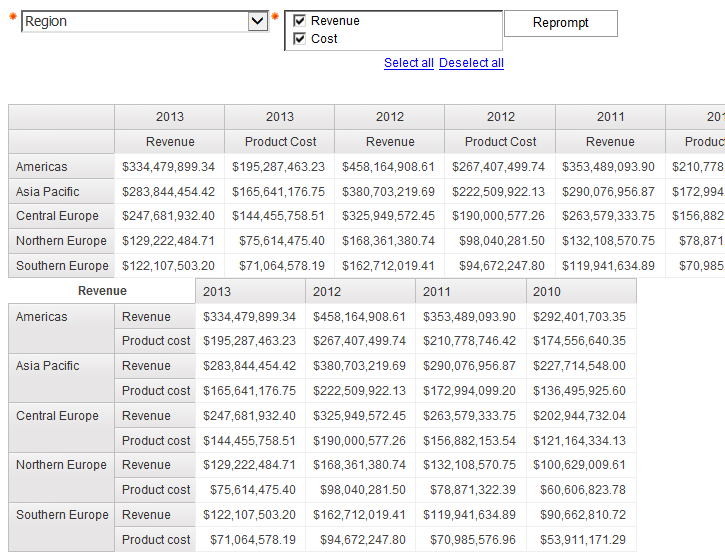
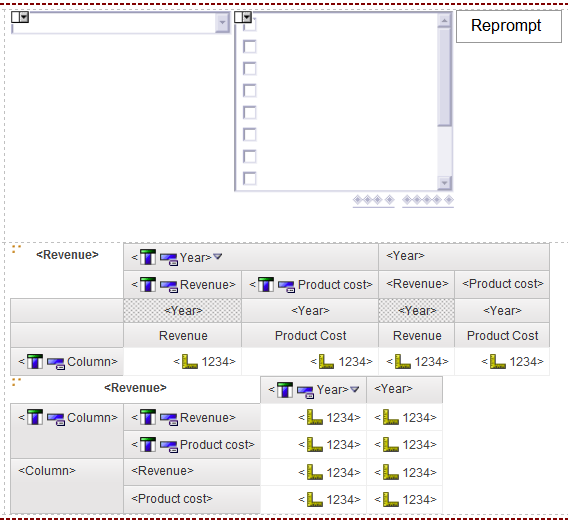
Two crosstab above are generated based on selected measures. The one is with columns, while another is with rows.
Prompt
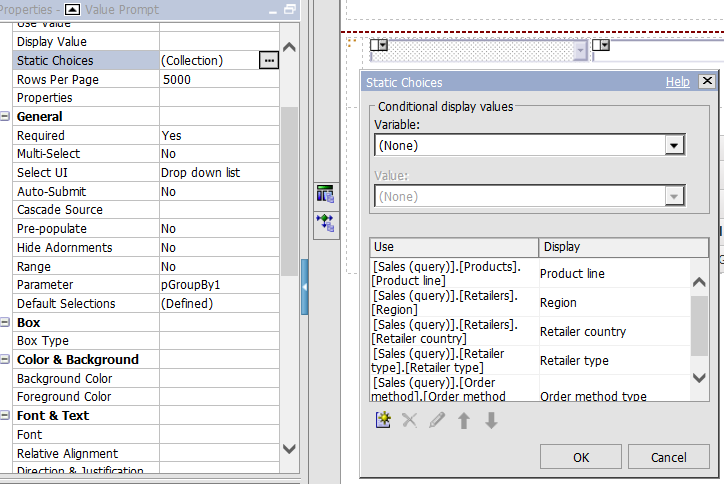
First value prompt
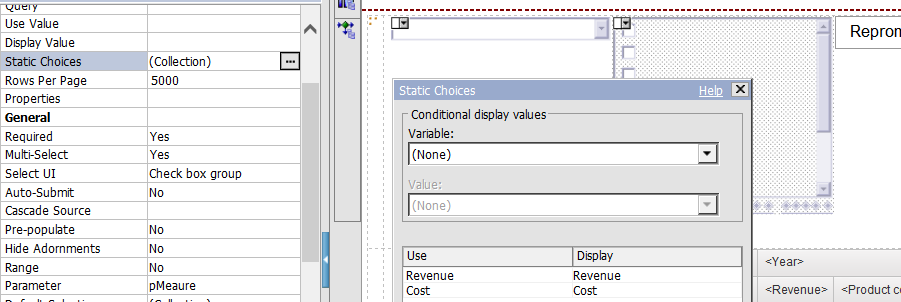
Second value prompt
Please note that this value prompt is simple one without prompt token.
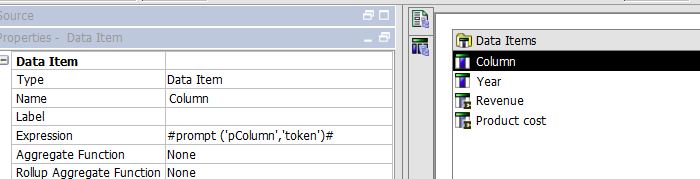
Query
Layout
Define two style variables as ShowRevenue and ShowCost as below
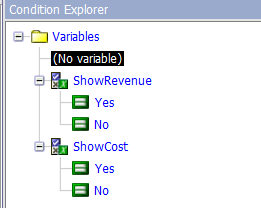
ParamDisplayValue('pMeaure') Like '%Revenue%'
ParamDisplayValue('pMeaure') Like '%Cost%'
Layout below
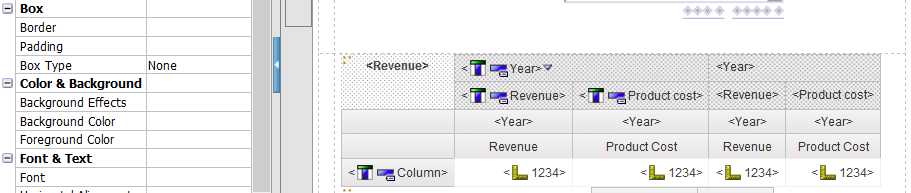
One challenge is to make column aligned. If we simply supress measure and its related section, then somehow column between year and measures will be misaligned. To resolve this issue, we have added two crosstab spaces and override them with year and measure description.
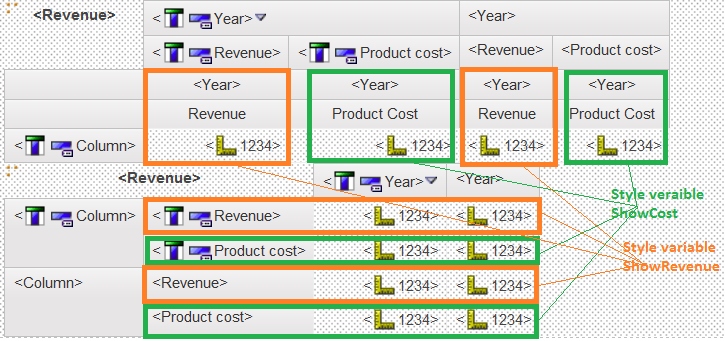
Applying style variable below, we can get expected format.
No comments:
Post a Comment