Context
Please see sample below, where the color should be consistence among pie chart, area chart and table
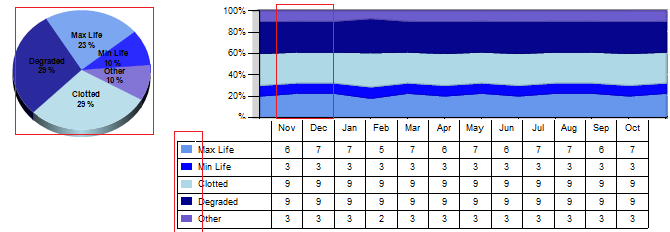
This document below shares some idea to resolve this issue from two different cases: 1) static series and 2) dynamic series.
Static series
In this case, you know exactly how any series are used in chart or table. This case happens when your data set is columns based, and so you can drag exact columns into chart or tablix.
- Area chart
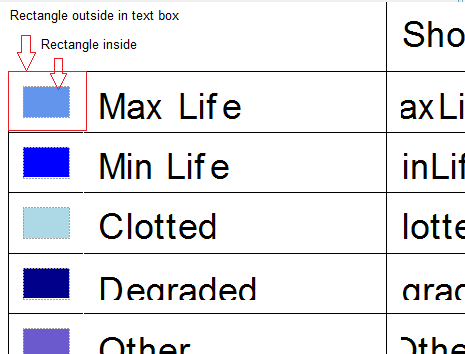
- Tablix
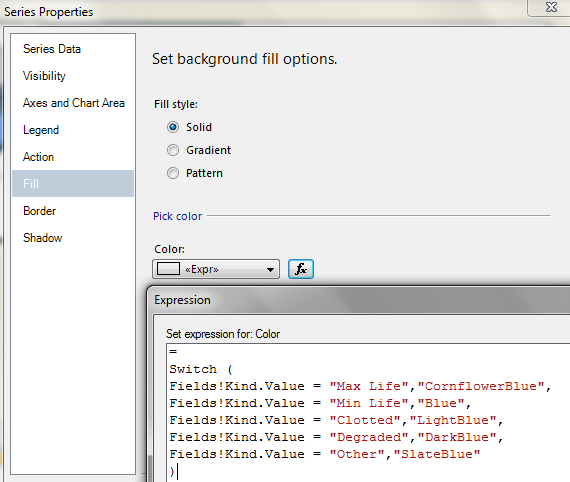
Specify color one by one
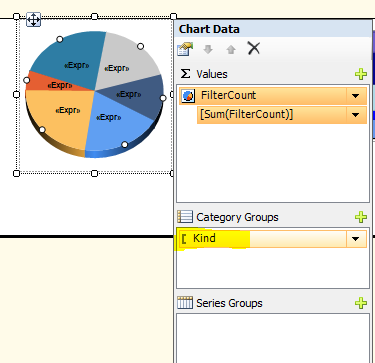
- Pie chart
Pie chart data is not from column, it is based on data as below
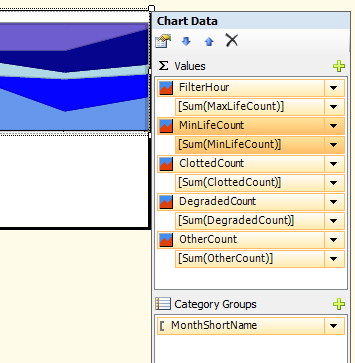
Dynamic series
In this case, data series is derived from data, please see sample below
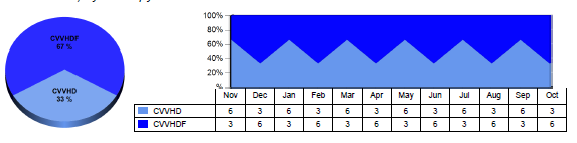
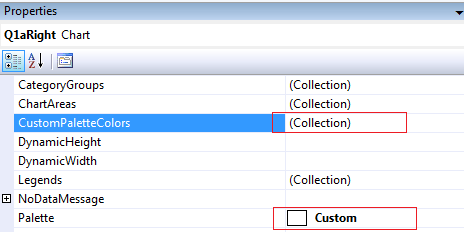
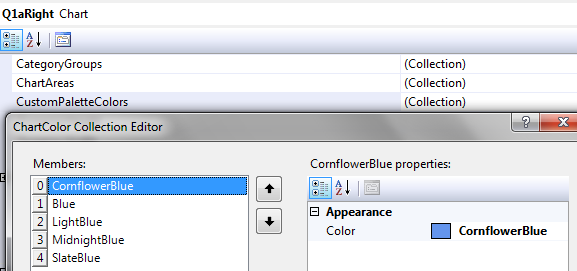
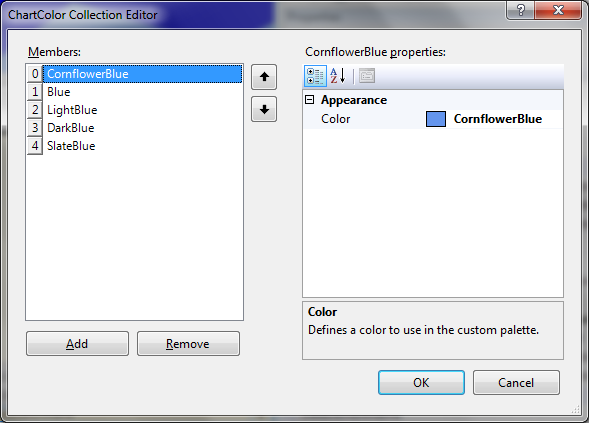
- Area chart and Pie Chart
Custom Platte Colors can be applied for both pie chart and column chart, as long as the sore sequence is same.
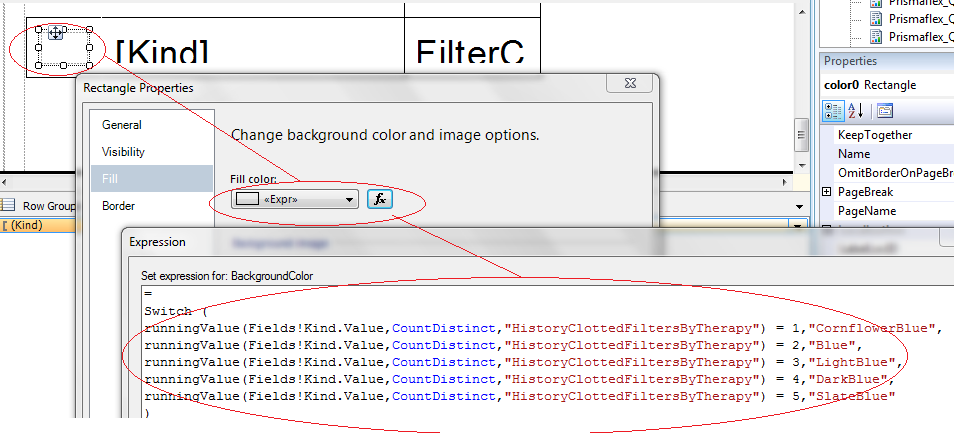
- TabLix
This is a little challenge to specify color for each series in table. The solution is to use expression to control color based on group sequence.
No comments:
Post a Comment