Context
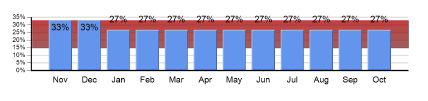
While there is no color range functionality in Cognos, there is range chart in SSRS. We can use this chart type to highlight chart area as below
Implementation


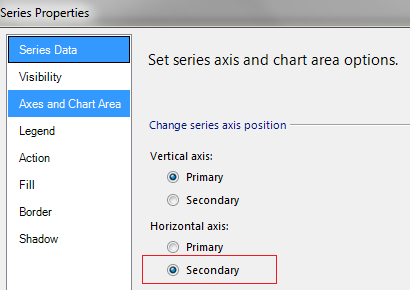
Associate the series with a secondary axis so the color extends across the entire length of the chart.
Note:
in case when the range is not static, it is necessary to make sure that the range will properly behave: 1) range should not show when not needed; and 2) range should always cover reasonable range. In other word, if the maximum value is less than target, then the maximum value can not be used to mark a range. if the maximum value is only a little bigger than target, then the maximum value can not be used to mark a range either. therefore, we have define a minimum range to display.
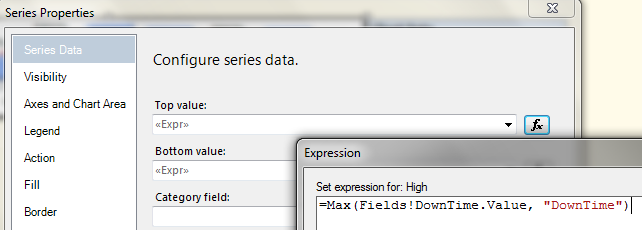
High value:
= IIF( CInt(Lookup("Target Needed",Fields!Parameter.Value, Fields!Value.Value,"ReportParameters")) = 0,
0,
IIF( Max(Fields!Timespan.Value, "Timespan") - CInt(Lookup("Specific Target",Fields!Parameter.Value, Fields!Value.Value,"ReportParameters")) > 2,
Max(Fields!Timespan.Value, "Timespan"),
CInt(Lookup("Specific Target",Fields!Parameter.Value, Fields!Value.Value,"ReportParameters")) + 2)
)
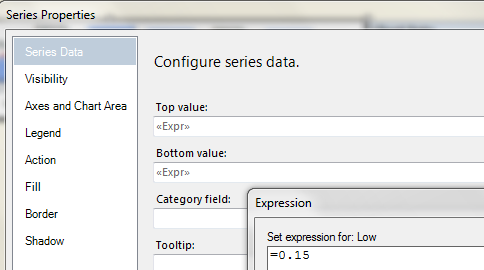
Low Value
= IIF( CInt(Lookup("Target Needed",Fields!Parameter.Value, Fields!Value.Value,"ReportParameters")) = 0,
0,
CInt(Lookup("Specific Target",Fields!Parameter.Value, Fields!Value.Value,"ReportParameters"))
)
Note:
in case when the range is not static, it is necessary to make sure that the range will properly behave: 1) range should not show when not needed; and 2) range should always cover reasonable range. In other word, if the maximum value is less than target, then the maximum value can not be used to mark a range. if the maximum value is only a little bigger than target, then the maximum value can not be used to mark a range either. therefore, we have define a minimum range to display.
High value:
= IIF( CInt(Lookup("Target Needed",Fields!Parameter.Value, Fields!Value.Value,"ReportParameters")) = 0,
0,
IIF( Max(Fields!Timespan.Value, "Timespan") - CInt(Lookup("Specific Target",Fields!Parameter.Value, Fields!Value.Value,"ReportParameters")) > 2,
Max(Fields!Timespan.Value, "Timespan"),
CInt(Lookup("Specific Target",Fields!Parameter.Value, Fields!Value.Value,"ReportParameters")) + 2)
)
Low Value
= IIF( CInt(Lookup("Target Needed",Fields!Parameter.Value, Fields!Value.Value,"ReportParameters")) = 0,
0,
CInt(Lookup("Specific Target",Fields!Parameter.Value, Fields!Value.Value,"ReportParameters"))
)
No comments:
Post a Comment