Please see sample below
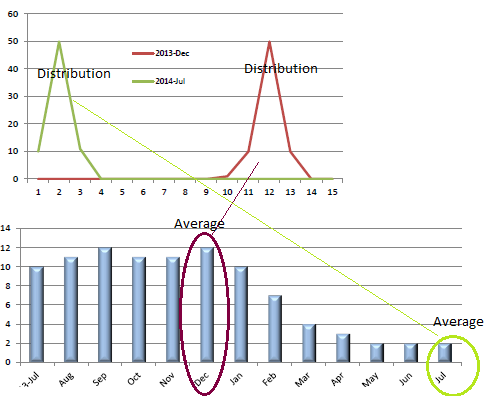
While the average is very easy to handle, or sum(MeasureX) / Sum(count), the distribution is not easy to generate. The following script is used to get distribution as needed. This script is to give us a simple idea, which can be extended, based on different requirement. This solution is simple and easy to understand.
CREATE TABLE [dbo].NUMS(N int NOT NULL PRIMARY KEY CLUSTERED ( N ) )
declare @i as int
set @i = 0
while @i <=1000
begin
insert into NUMS values (@i)
set @i = @i+1
end
select P.N, count(*) as C
from
(
SELECT MeasureX as value
FROM Fact INNER JOIN DimDate ON Fact.DateKey = DimDate.DateKey
WHERE DimDate.YearMonthNumber = 201407
) R
inner join
(
select N
from Nums inner join
(
SELECT min(Fact.MeasureX) as mn, max(Fact.MeasureX) as mx
FROM Fact INNER JOIN DimDate ON Fact.DateKey = DimDate.DateKey
WHERE DimDate.YearMonthNumber = 201407
) R on (N between mn and mx)
) P on (R.value >= P.N and R.value < P.N+1)
group by P.N
No comments:
Post a Comment