Please see chart below for requirement. The goal is to show total of all stacks within each bar.
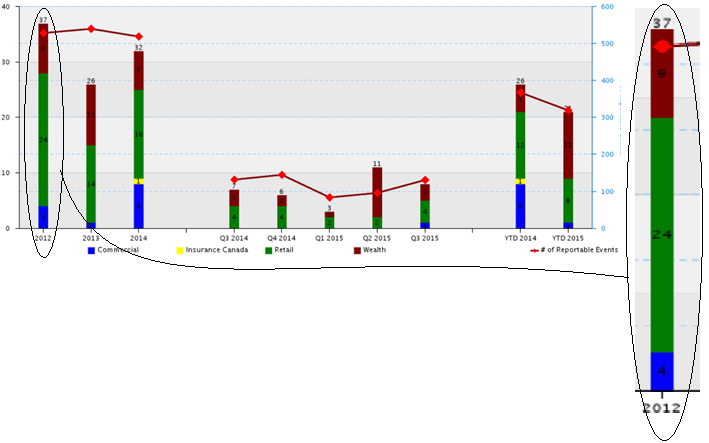
Show values on stack bar
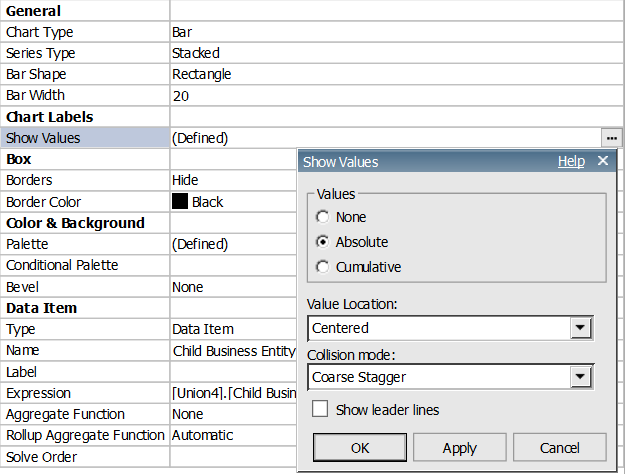
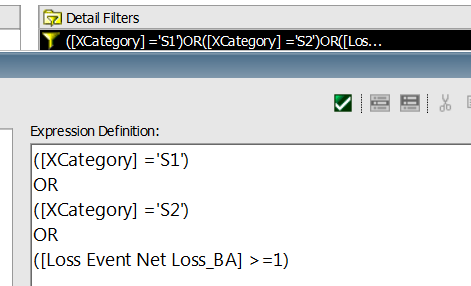
Remove 0 values on bar
If 0 values are not removed, then chart become very fuzzy, as there are many 0 values displayed on chart.
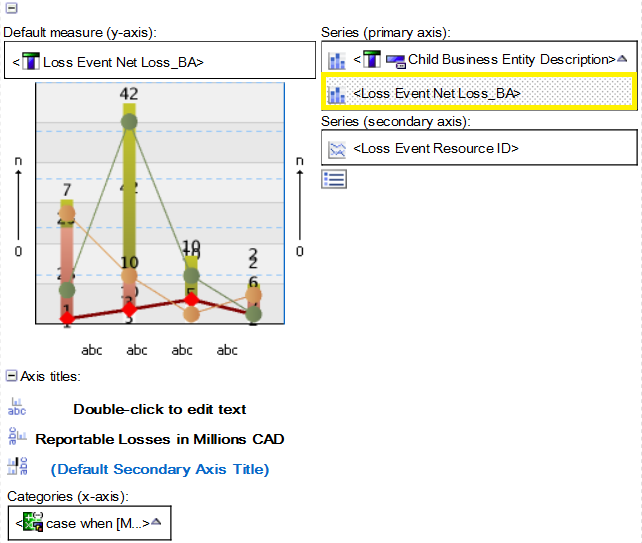
Add new series to get total value for each column
When dragging measure as the second series, then the total will be automatically aggregated, in other word, we reuse the same measure, or the same query. We do not need to add new measure to calculate total based on column.
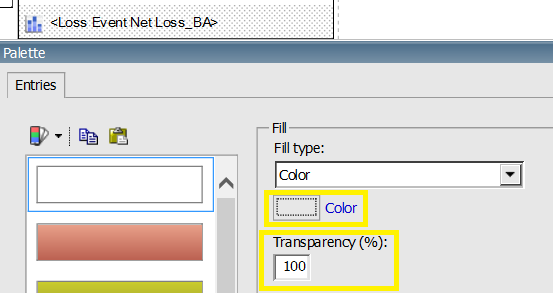
Make total Bar as transparent
The only thing we need is to show total number on top of each Bar.
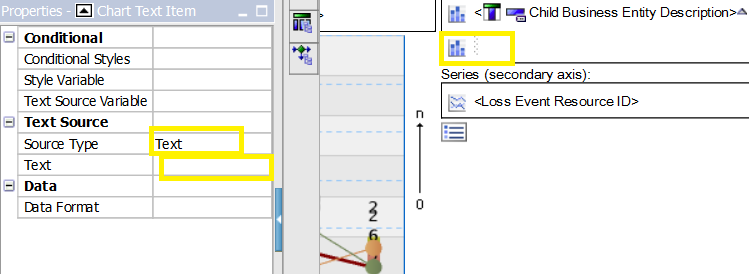
Suppress legend for total bar
Unfortunately, Cognos cannot perform conditional rendering and styles for each individual measure. the only way to do is to make it invisible by making empty space as text with source type. However, this hidden legend still takes space. The advanced solution is develop customized legend with repeater.
Note based on Cognos 11, all data can be formatted
There is another way to add total as below:
1) Add total with another measure at Total level;
2) drag this measure to series. (drag to the chart area, then you will get new total measure with separated series)
3) Change type to Line
4) change line and markers to Markers
5) series type clustered
6) Make marker size as 0
7) data format on chart node member
No comments:
Post a Comment