1 Problem
This report below illustrates some special requests:
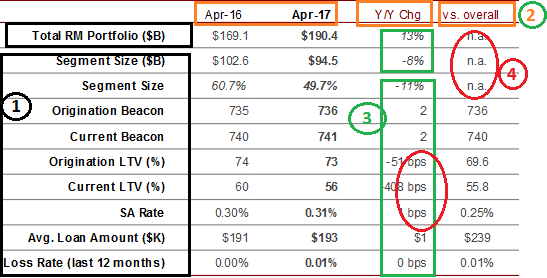
1) There are different measures located on rows and based on two group. The first row is total, while all others is a sub group;
2) different columns are specified with three different granularities: a. two months, b) Month difference and c) all values are based on total, not sub group, which is different from two months.
3) With respect to Month difference, there are different calculation, such as simple A-B and (A-B)/B.
4) Some obvious override apply for the format for crosstab.
2 Analysis
This crosstab is not easy to build, as the granularity are different in both directions, columns and rows. One of solutions is to use crosstab override, which is approved very difficult. Another solution is to use singleton, but the problem is that each singleton in general need to a separated query. As it is so many cells to override, we need to have many queries to create. This solution is not practical either. The goal is look into a solution with one query and gets all data.
3 Solution
According to the goal with clear structure, we need to break crosstab into two different sub crosstabs, and break crosstab with more columns as needed, and then STITCH them together.
Layout: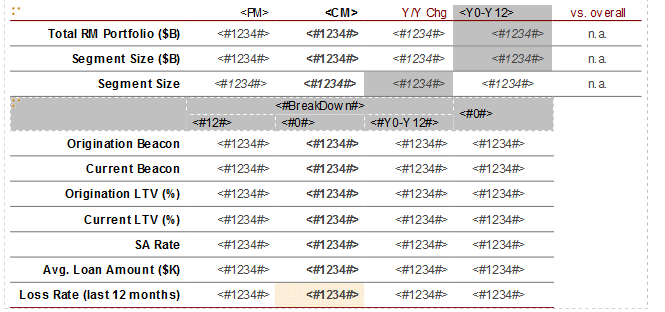
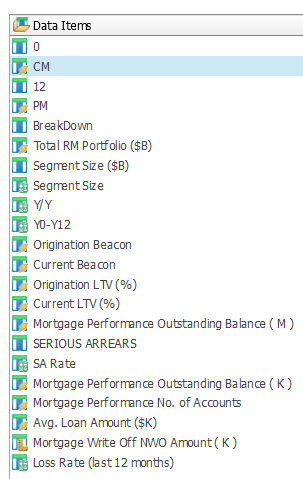
Single Query:
A few practical ideas are derived below:
1) Use crosstab node is resolve different granularities for columns, such as break down and crosstab space as total
2) Use different sub crosstabs to make crosstab handle different granularities.
3) Use different columns to calculate different granularities and then put it together with show/hidden to avoid crosstab override.
4) As each data container (list, crosstab and chart) generates different SQLs, we can use the same query to perform multiple data sets. Please note that singleton is different from list, crosstab and chart, as singleton requests a separated Cognos Query.
No comments:
Post a Comment