Check list of all posts
The date dimension is the most critical in BI data modeling. There are many ways to create the date dimension, including DAX, Power query, and database. This article assumes that we have a standard date dimension available, and our focus is to handle the relative date. In the real project, especially at the enterprise level, the date is complicated and highly customized based on the fiscal calendar, even with 4-4-5. The regular standardized calendar may not work in a real BI project. I have discovered a power solution for Cognos - Model Relative Time Dimension for Cognos Framework Manager - Applied for Relational and DMR. However, this solution doesn't work with Power BI, as we can't create a relationship with SQL in Power BI.
This article is to share two model concepts for power BI.
Option 1: Column approach
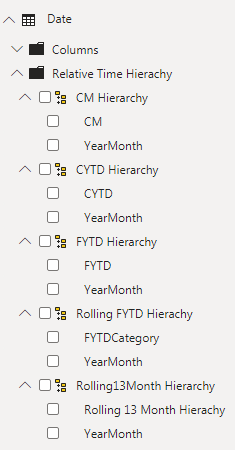
1.Create date dimension with all relative date columns, such as Current Month, YTD, FYTD, Rolling 13 Month, rolling FYTD
We can determine the current month from ETL during data refresh based on the business process. Assume the current month is September 2020, then we can get all derived columns as needed.
2.Turn these relative dates as alternate hierarchies, Current Month hierarchy, YTD hierarchy, FYTD hierarchy, Rolling 13 Month hierarchy, rolling FYTD hierarchy. Based on this model, you can drag any measures and drill up and down with hierarchies.
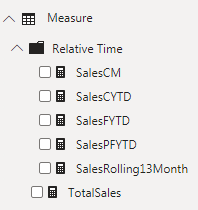
3.Turn measures to relative dates based measures, such as SalesCM, SalesYTD, SalesFYTD, SalesRolling13Month, and SalesPFYTD
TotalSales = SUM(Sales[Sales])
SalesCM = CALCULATE( [TotalSales],'Date'[CM] ="CM" )
SalesCYTD = CALCULATE([TotalSales],'Date'[CYTD] ="CYTD")
SalesFYTD = CALCULATE([TotalSales],'Date'[FYTD] ="FYTD")
SalesPFYTD = CALCULATE([TotalSales],'Date'[FYTDCategory] ="1-FYTD")
SalesRolling13Month = CALCULATE([TotalSales],'Date'[Rolling13Category] ="Rolling13Month")
4.It is very easy to create any reports as below
Option 2: Row approach
Requirements:
End users can choose pre-defined data ranges as needed, and custom data range, which can be specified any date to any date.
Assumptions:
Use Power query instead of using DAX.
Step 1: Create a standard date dimension with Power Query, or database
Step 2: Define a relative Periods as needed, such as DatePreviousDay, DateCurrentMonth and DateCustom
DatePreviousDay :
let
Source = Date,
#"Sorted Rows" = Table.Sort(Source,{{"Date", Order.Descending}}),
#"Filtered Rows" = Table.SelectRows(#"Sorted Rows", each ([HasData] = "Yes")),
#"Kept First Rows" = Table.FirstN(#"Filtered Rows",2),
#"Removed Other Columns" = Table.SelectColumns(#"Kept First Rows",{"Date"}),
#"Added Custom" = Table.AddColumn(#"Removed Other Columns", "Type", each "Previous Day"),
#"Added Custom1" = Table.AddColumn(#"Added Custom", "Order", each 1)
in
#"Added Custom1"
DateCurrentMonth
let
Source = Date,
#"Grouped Rows" = Table.Group(Source, {"YYYYMM"}, {{"Index", each _, type table [Date=nullable date, Year=number, Start of Year=date, End of Year=date, Month=number, Start of Month=date, End of Month=date, Days in Month=number, Day=number, Day Name=text, Day of Week=number, Day of Year=number, Month Name=text, Quarter=number, Start of Quarter=date, End of Quarter=date, Week of Year=number, Week of Month=number, Start of Week=date, End of Week=date, Fiscal Year=number, Fiscal Quarter=number, Fiscal Month=number, Day Offset=number, Month Offset=nullable number, Year Offset=nullable number, Quarter Offset=nullable number, Date Display=any, YYYYMMDD=number, YYYYMM=number, Year Month Long Name=text, Year Month Short Name=text, FYYYYQQ=number, Fiscal Year Quarter=text, HasData=text]}}),
#"Sorted Rows" = Table.Sort(#"Grouped Rows",{{"YYYYMM", Order.Descending}}),
#"Kept First Rows" = Table.FirstN(#"Sorted Rows",1),
#"Expanded Index" = Table.ExpandTableColumn(#"Kept First Rows", "Index", {"Date", "HasData"}, {"Date", "HasData"}),
#"Filtered Rows" = Table.SelectRows(#"Expanded Index", each ([HasData] = "Yes")),
#"Removed Other Columns" = Table.SelectColumns(#"Filtered Rows",{"Date"}),
#"Added Custom" = Table.AddColumn(#"Removed Other Columns", "Type", each "Current Month"),
#"Added Custom1" = Table.AddColumn(#"Added Custom", "Order", each 2)
in
#"Added Custom1"
DateCustom - all available dates
let
Source = Date,
#"Filtered Rows" = Table.SelectRows(Source, each ([HasData] = "Yes")),
#"Removed Other Columns" = Table.SelectColumns(#"Filtered Rows",{"Date"}),
#"Added Custom" = Table.AddColumn(#"Removed Other Columns", "Type", each "Custom"),
#"Added Custom1" = Table.AddColumn(#"Added Custom", "Order", each 3)
in
#"Added Custom1"
Merge all relative time together as Period
let
Source = DatePreviousDay,
#"Appended Query" = Table.Combine({Source, DateCurrentMonth, DateCustom}),
#"Changed Type" = Table.TransformColumnTypes(#"Appended Query",{{"Date", type date}, {"Type", type text}, {"Order", Int64.Type}})
in
#"Changed Type"
Step 3. Create relationship as below
Step 4. Add slicer Periods, create date slicer with filter below
[Date Slicer Filter] is 1
while measure
[Date Slicer Filter] = INT( SELECTEDVALUE(Periods[Type])="Custom")
Doing this way will enable date slicer only work when Custom is selected.
Step 5: Date range is determined
Start Date =
CALCULATE ( MIN ( 'Date'[Date] ), ALLSELECTED ( 'Date'[Date] ) )
End Date =
CALCULATE ( MAX ( 'Date'[Date] ), ALLSELECTED ( 'Date'[Date] ) )


No comments:
Post a Comment