This article provides a practical solution for generating Power BI reports using a customer-requested report template. Although Power BI offers interactive reports, some clients still prefer generating reports based on predefined templates, often dictated by regulatory bodies. In this article, we will explore a solution for stitching together Power BI matrix visuals to meet these template requirements.
Requirement:
Many clients require reports to adhere to specific templates, which are typically defined by regulatory bodies. While Power BI offers interactive reports, clients often desire a fixed template layout for consistency and compliance.

Analysis:
Using simple matrix visuals alone will not suffice since different sections of the report may have varying headers. It is not possible to have separate visuals with different headings. Additionally, the length of each section might be dynamic, depending on the selected criteria.
Solution:
Although Power BI does not provide a direct way to create visuals based on a template, we can utilize a workaround. By creating a report template with a row header, we can apply different logic to each measure. This approach allows us to identify whether a particular section is a header or content. Furthermore, we can customize the header text as required.
Implementation:
Step 1: Create a report template by incorporating the desired text from the business requirements.

Step 2: Add a new column, such as "ReportEligible = 1," to establish the relationship. This column should also be added to the Fact table to create a weak relationship.

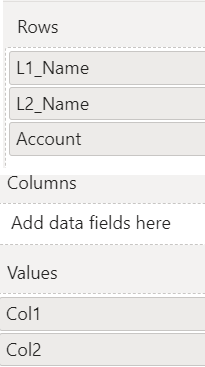
Step 3: Build a model that combines the report template with any additional columns or dimensions, treating them as rows.
VAR _L1_ID =
SELECTEDVALUE ( ReportTemplate[L1_ID] )
VAR _L2_ID =
SELECTEDVALUE ( ReportTemplate[L2_ID] )
RETURN
SWITCH (
TRUE (),
NOT ISINSCOPE ( 'ReportTemplate'[L2_Name] ), SWITCH ( _L1_ID, 1, "Col1_Titel1($)", 2, "Col1_Titel2(%)", 9, "Col1_Titel9(%)" ),
SWITCH (
TRUE (),
_L1_ID = 1
&& _L2_ID = 1, FORMAT ( [Level1_Name_1_Level2_Name_1(Col1)], "$#.00" ),
_L1_ID = 1
&& _L2_ID = 2, FORMAT ( [Level1_Name_1_Level2_Name_2(Col1)], "$#.00" ),
_L1_ID = 2
&& _L2_ID = 1, FORMAT ( [Level1_Name_2_Level2_Name_1(Col1)], "#.0%" ),
_L1_ID = 2
&& _L2_ID = 2, FORMAT ( [Level1_Name_2_Level2_Name_2(Col1)], "#.0%" ),
_L1_ID = 9
&& _L2_ID = 1, FORMAT ( [Level1_Name_9_Level2_Name_1(Col1)], "#.0%" ),
_L1_ID = 9
&& _L2_ID = 2, FORMAT ( [Level1_Name_9_Level2_Name_2(Col1)], "#.0%" )
)
)
Col2 =
VAR _L1_ID =
SELECTEDVALUE ( ReportTemplate[L1_ID] )
VAR _L2_ID =
SELECTEDVALUE ( ReportTemplate[L2_ID] )
RETURN
SWITCH (
TRUE (),
NOT ISINSCOPE ( 'ReportTemplate'[L2_Name] ), SWITCH ( _L1_ID, 1, "Col1_Titel1($)", 2, "Col1_Titel2(%)", 9, "Col1_Titel9(%)" ),
SWITCH (
TRUE (),
_L1_ID = 1
&& _L2_ID = 1, FORMAT ( [Level1_Name_1_Level2_Name_1(Col2)], "$#.00" ),
_L1_ID = 1
&& _L2_ID = 2, FORMAT ( [Level1_Name_1_Level2_Name_2(Col2)], "$#.00" ),
_L1_ID = 2
&& _L2_ID = 1, FORMAT ( [Level1_Name_2_Level2_Name_1(Col2)], "#.0%" ),
_L1_ID = 2
&& _L2_ID = 2, FORMAT ( [Level1_Name_2_Level2_Name_2(Col2)], "#.0%" ),
_L1_ID = 9, BLANK ()
)
)
Step 5: Define all required measures based on the specific business requirements and fill in individual cells as needed.

Conclusion:
Generating Power BI reports based on a requested template is achievable through careful implementation. By leveraging report templates and utilizing relationships, measures, and a model that incorporates the desired structure, you can successfully stitch together matrix visuals to meet client expectations.
No comments:
Post a Comment