Major advantages:
Easy to develop report, as data is ready there
Archived good performance
Major disadvantages:
Need to develop ETL, only small percentage of generated data will be used
The combination is still limited
This document is intended to provide four other solution options.
- Turn relative time to measure
- Use parameter map to resolve complicated relative time issue
- Use joined query at report level to address rolling period to date issue
- Use moving average / Total
- make and sort a crosstab report with different time periods
- Use parameter map to resolve complicated relative time issue
- Use joined query at report level to address rolling period to date issue
- Use moving average / Total
- make and sort a crosstab report with different time periods
This document is intended to provide four other solution options. By the way, this topic is related with another topic - How to simplify and centralize date logic in ETL and Report
Solution option 1 - Turn relative time to measure
Advantages :
- yield much better performance and therefore scalable by turning table full screen to join with stitched query; and
- It will make report development much easier.
Disadvantages:
- When there is new requirement, you probably need to change framework manager to add new STAR scheme, which make Framework very complicated
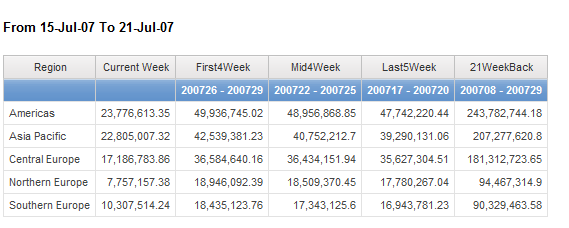
A similar sample is provided below.
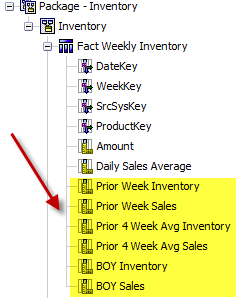
The process to build these measures:
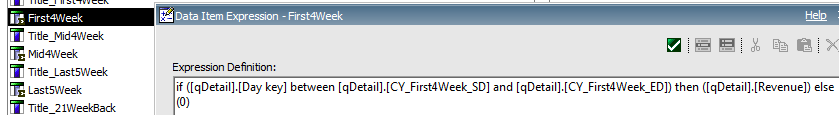
Step 1: Create multiple query object s based on the same fact table AG_FACT_OPS_WeeklyInventory, and named with different name as PriorWeek, 4WeekAgo and BOY (the week 53 of last year). In addition, create a new date offset table to setup relative date
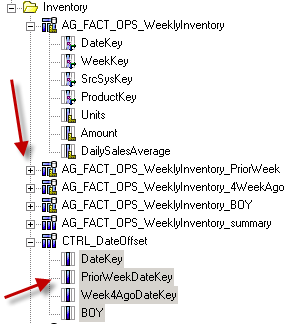
Step 2: Create multiple Model object s based on the all fact tables from database layer
Step 3: Build relationship to all dimensions for Model object s except data dimension. The real key is to Join fact table with CTRL_DateOffset table for two cases:
Case 1: simple join for point to time data
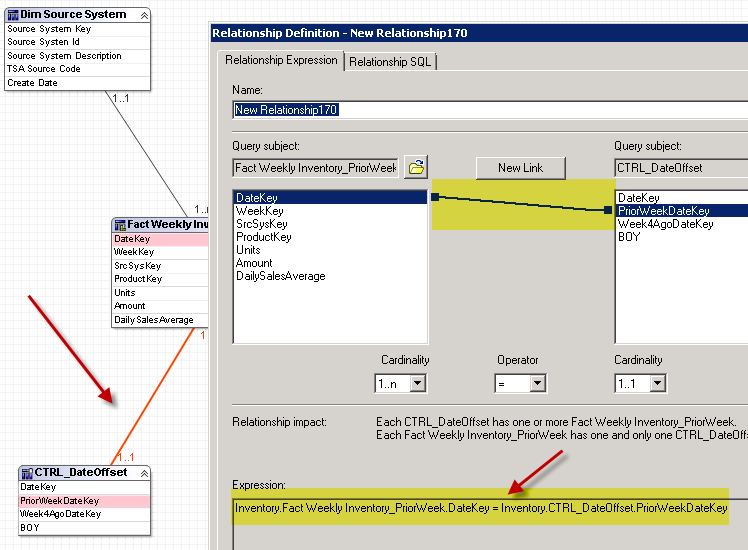
Case 2: join with expression using between for aggregate data, such as 4 weeks summary
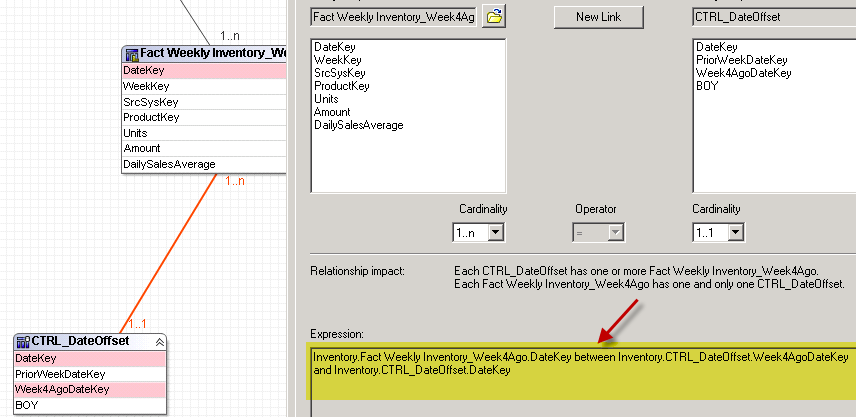
Step 4: Build the relationship between date dimension and CTRL_DateOffset

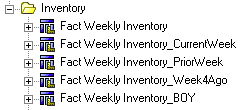
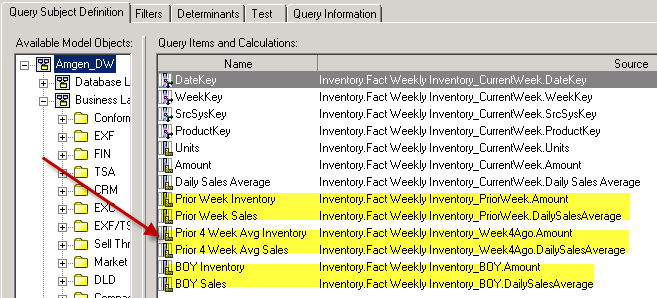
Step 5: defined a combine inventory Fact on business layer as below
Note:
- Eliminate CTRL_DateOffset table, instead, accommodated them into Dim Time. The advantage is that we will have a clear STAR scheme, not snowflake.
- Removed step 1 to create multiple query object s based on the same fact table on database layer. Instead, there is only one fact table on database layer, while there are many fact model query subject on business layer. This will make model clearer and less effort than before.
Solution option 2 – Use parameter map to resolve complicated relative time issue
To get complicated time frames, the best way is to parameter map. The following sample is used to demonstrate this idea. You can download report specification and query for review in detail
The main challenge for this sample is to find the right week number when the week is cross year end. If we don’t use the ETL, relative measure described above, then the parameter map is probably the best option. Once specific weeks are defined, data can be filtered out as exactly data needed.
Step 1. Build query to get relative time. Note that all detail query result should be converted as consistant type.
select convert(varchar(50),'CY_CurrentWeek_SD') as PKey, convert(int,DAY_KEY) as Value from gosales.TIME_DIMENSION where DAY_DATE = '2007-07-15'
UNION
select convert(varchar(50),'CY_CurrentWeek_ED') as PKey, convert(int,year(DATEADD(day, +6,DAY_DATE))*10000 + month(DATEADD(day, +6,DAY_DATE))*100 + day(DATEADD(day, +6,DAY_DATE))) as Value from gosales.TIME_DIMENSION where DAY_DATE in (select DAY_DATE from gosales.TIME_DIMENSION where DAY_DATE = '2007-07-15')
UNION
...............
Step 2. Load query above into database layer, SQL setting is native. This setting will give you flexibility to get complicated logic.
Step 3. Create parameter map based on query Relative time
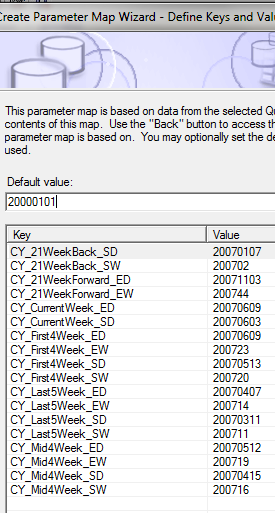
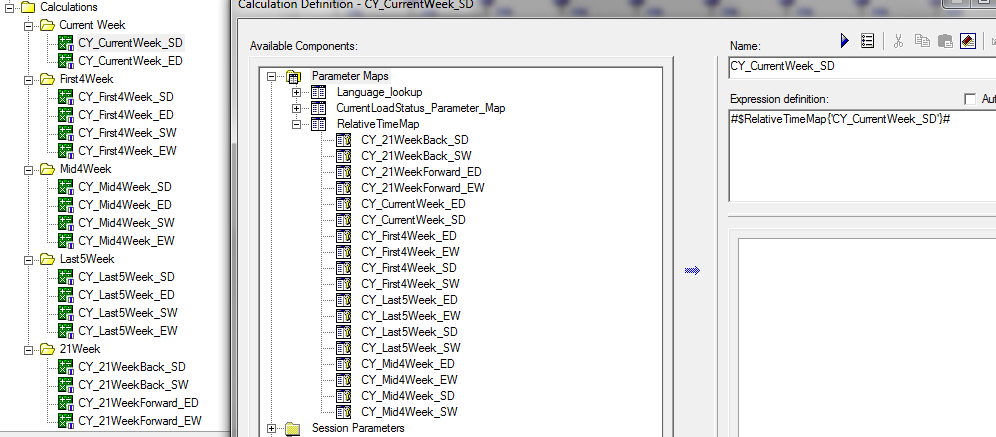
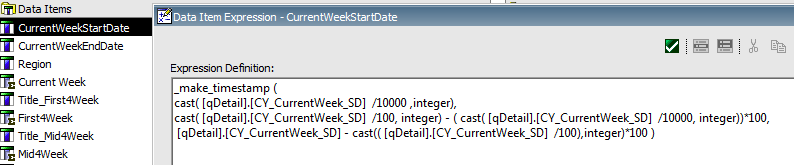
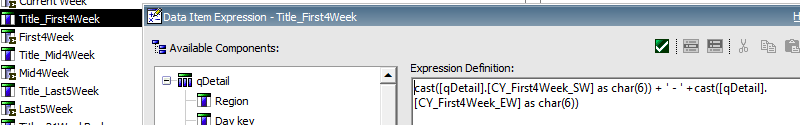
Step 4. Create all calculations based on parameter map
Step 5. Define query

Step 5. Define report
Note:
Advantages:
- Good performance, as you can filter out right set of data
- Very flexible to define date ranges and their title, as long as SQL statement can generate
Disadvantages:
- Can’t or very difficult to handle rolling period, especially for trend chart
Solution option 3 – Use joined query at report level to address rolling period to date issue
To get trend data for rolling period, two solutions are provided in this sample. Please download report specification for review in detail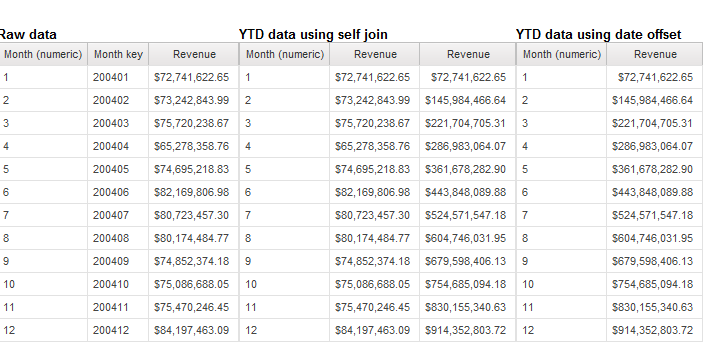
In case when you can’t change ETL and Framework manager, you have to realize such an idea in report studio. The query in report studio will be used to mimic the concept to turn relative time to measures.
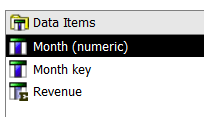
Step 1: Define the basic query with data for each month
Step 2: Join this query by itself as blow
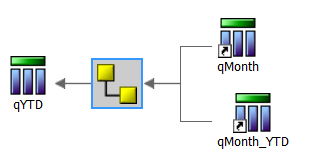
With join: [qMonth_YTD].[Month (numeric)] <=[qMonth].[Month (numeric)]
YTD revenue is [qMonth_YTD].[Revenue]
Another way is to create time offset and then join to month query
Step 1: create date time offset for YTD

Step 2: Join month data with time offset

With join: [qMonth].[Month key] between [qTimeOffset_YTD].[BeginMonth] and [qTimeOffset_YTD].[EndMonth]
YTD revenue: [qMonth].[Revenue]
Solution option 4 – Use moving average / Total
If the period is clear defined, then moving total is the good solution to resolve trend issue. Please see sample below and download specification for detail
4 month total: moving-total([Revenue], 4 )
4 month total for region: moving-total([Revenue], 4 for [Region])
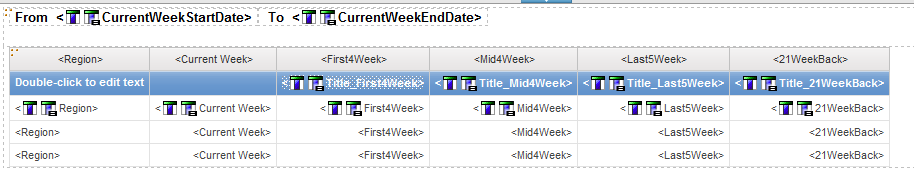
Solution option 5 – make and sort a crosstab report with different time periods
Context
Please look at report below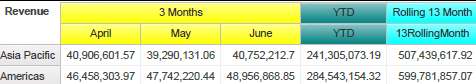
It is requested to sort by columns as well as rows based on YTD revenue
There are many ways to do it. Please check my old post How to handle relative time (relational model focused) for reference. The solution described below can be considered as another option. Please download report specification for detail review
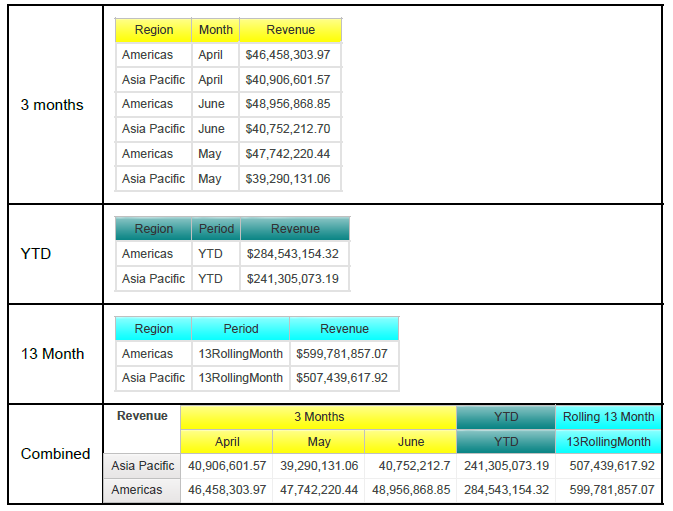
Union all data as a single query for crosstab
The idea is to make time period as X columns. We need to make sure that your query is union able, meaning that we need to cast data item as sample type

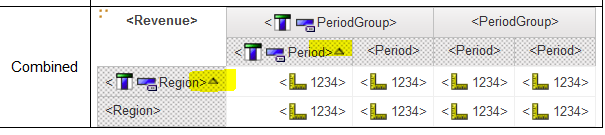
Define sort columns for both X and Y direction
To sort time period columns, or X direction, an XSort column is defined to give a number based on either period, or period group.To sort rows, or X direction, an YSort column is defined to get measure value

Notes
This solution is the appropriate one when- there is big data,
- columns are dynamically determined
Excellent work :)!
ReplyDelete