- Use shared query for both crosstab and chart
- Use separated queries for both crosstab and chart with “Linking data item”
- Use portlet to connect two separated reports via drill up and down communication channel.
We could use all three methods for one report to achieve maximum flexibility.
- Use shared query
While a single query is used to collect all the data items, the report engine determines exactly the minimal set of query to create each object.
In order to create the report required it is link the dimensions from each object that will participate in the drill up and down. Given a sample
- Chart D1, D2, M1
- Crosstab: D1, D3, M2
M1: aggregate([M1] within set [D3], where D3 belongs to cross tab, but not in chart
M2: aggregate([M2] within set [D2], where D2 belongs to Chart, but not in crosstab
- Description
- Single query for the whole page
- Make sure that each measure should cover all dimension from other chart
- Each measure needs to be clearly defined, such as the measure Break count is from Break aggregate, and break count is used for trend, however, we can’t use it in crosstab, as the count is break count as of today.
- Advantage
- Single query
- Very powerful if MDX applied
- Disadvantage
- Difficult to support different name space, such as we can’t use both Break and Break Aggregate
- Not very intuitive as it is not simply define crosstab and chart by itself
- Please check IBM reference article in detail
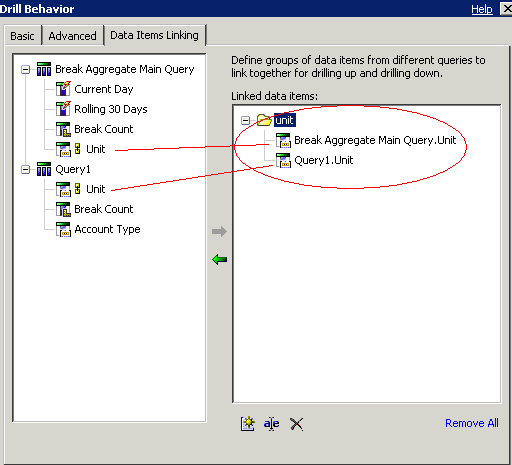
- Use separated queries with “Linking data item”
- Description
- Simply define each object
- In drill behavior, use the data item linking
- Advantage
- very intuitive as it simply define crosstab and chart by itself
- Disadvantage
- Difficult to support different name space, such as we can’t use both Break and Break Aggregate
- Use portlet to connect two separated reports via drill up and down communication channel.
- Description
- Define crosstab as a report, while chart is defined as another report
- Put both reports in Cognos views
- Then specify communication as below

- Advantage
- intuitive as it simply define crosstab and chart by itself
- It is another level of integration, as we could integrate report with method one or method two by this method.
- Disadvantage
- Difficult to support different name space, such as we can’t use both Break and Break Aggregate
- Please check IBM reference article in detail
http://www.ibm.com/developerworks/data/library/cognos/page206.html
Thank you very much! Very useful information, as I have opted to work with Share Query as illustrated by us above!
ReplyDelete