Requirement
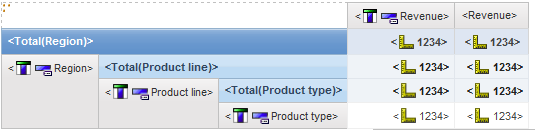
Below is a cross tab where all totals are located on top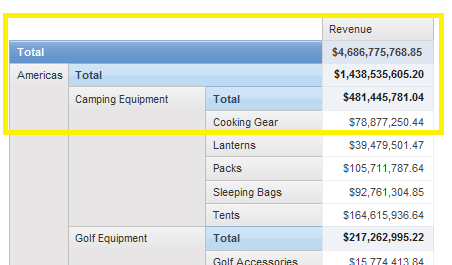
Layout
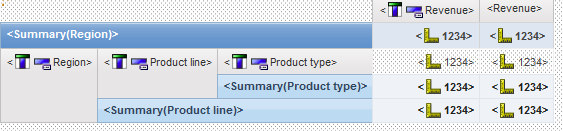
Step 1: Create normal cross tab as below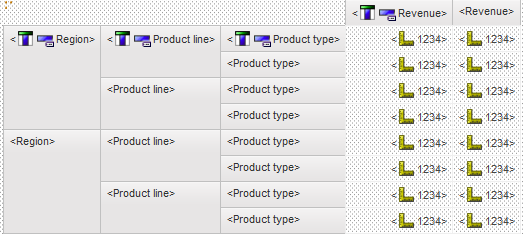
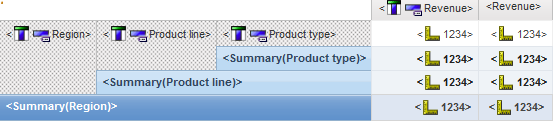
Step 2: highlight region, product line and product type, then click Automatic summary
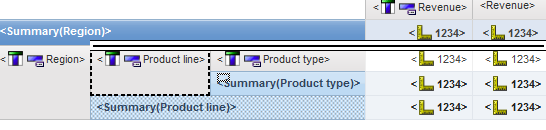
Step 3 Drag Summary (region) on top of region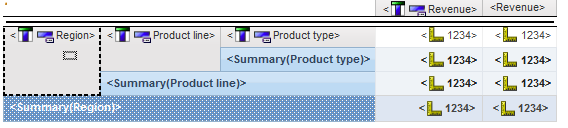
Step 4 Drag Summary (Product line) on top of product line, and Drag Summary (Product Type) on top of product Type
Do you plan on publishing a book? You should do as your blog is by far the best resource online for Cognos reporting.
ReplyDeleteImpressive work Sir....Take a Bow... for all your posts..:-)
ReplyDelete