Requirement
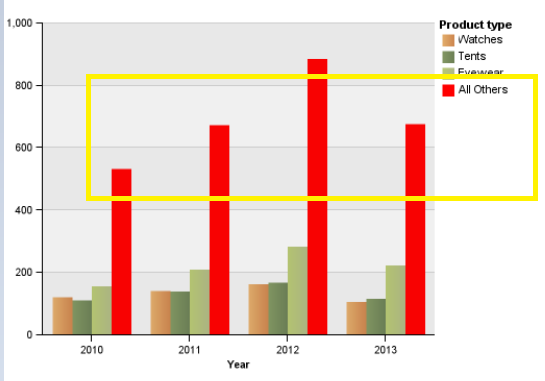
Create a simple chart with top 3 product types and all other product types based on revenue.
Layout
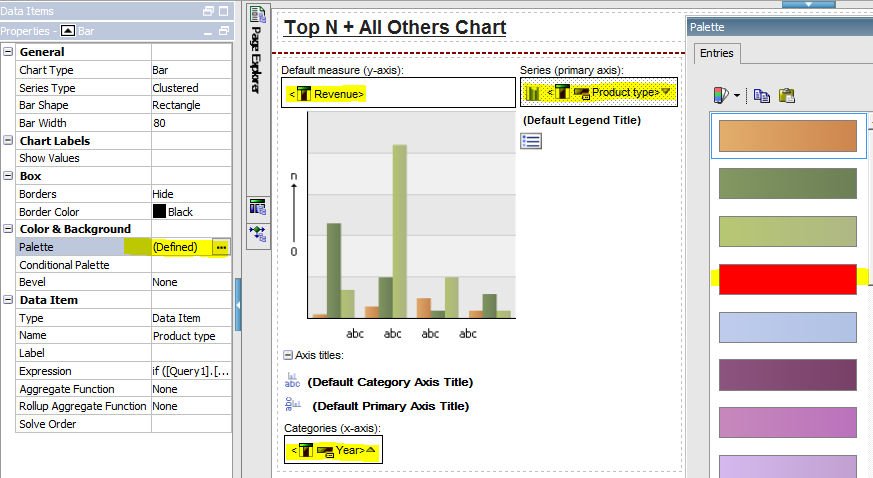
Chart is based on simple layout as below, to emphasize All Others product types, we mark this series as red color.
Query
Three different queries are separated described, as they are very different.
Relational
Query1 base
- Year: [Sales (query)].[Time].[Year]
- Product type: [Sales (query)].[Products].[Product type]
- Revenue: [Sales (query)].[Sales].[Revenue]
- TotalRevenue4ProductType: Total([Revenue] for [Product type])
- RankProductType: Rank([Revenue] at [Product type])
Query1
- Year: [Query1 base].[Year]
- Product type: if ([Query1 base].[RankProductType]<=3) then ([Query1 base].[Product type]) else ('All Others')
- Revenue: [Query1 base].[Revenue]
DMR
- Year: [Sales (analysis)].[Time].[Time].[Year]
- Top N: topCount ([Sales (analysis)].[Products].[Products].[Product type],3,[Revenue])
- Others: except ([Sales (analysis)].[Products].[Products].[Product type],[Top N])
- All Others***: (Type: Calculated Member) Aggregate(currentMeasure within set [Others])
- Product type: union ([Top N],[All Others])
- Revenue: (Type Measure)
*** there is another manual way to do it: a) define Aggregate(currentMeasure within set [Others]); b) define Member member ([Others],'All Others','All Others',[Sales (analysis)].[Products].[Products]); c) set ([All Others Ex])
Cube
Cube based Query is the same as DMR
No comments:
Post a Comment