-
Context
Active report is very good to deploy to iPAD. However, there are two challenges:
- Size. When size is big, it will take long time to load into client’s iPAD, and the performance can be impacted as well. This is problem for end user.
- Generation speed. As active report is very complicated, it takes very long time to generated .mht file. This is a major problem for developers and deployment.
Cognos version 10.2.1 has introduced a new technology RAVE. Instead of pre-generated all charts in Cognos server and then loaded to client side, the data can be package up into the Active Report for use in rendering a visualization. this document is intended to test this behavior.
Sample
A very easy sample is used to compare current chart engine and visualizations using IBM sample package Great Outdoors Sales.
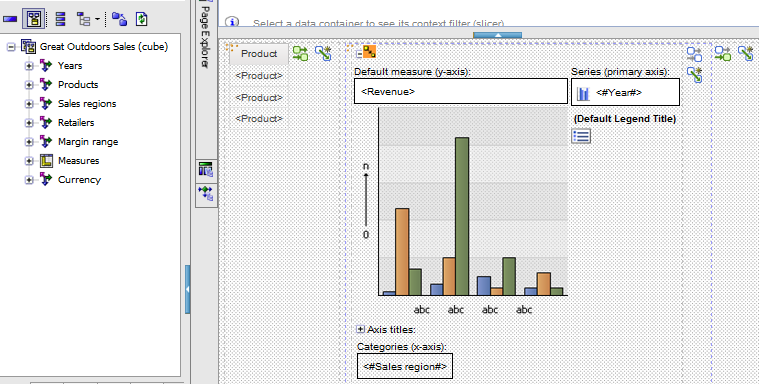
Normal chart in version 10.2.1
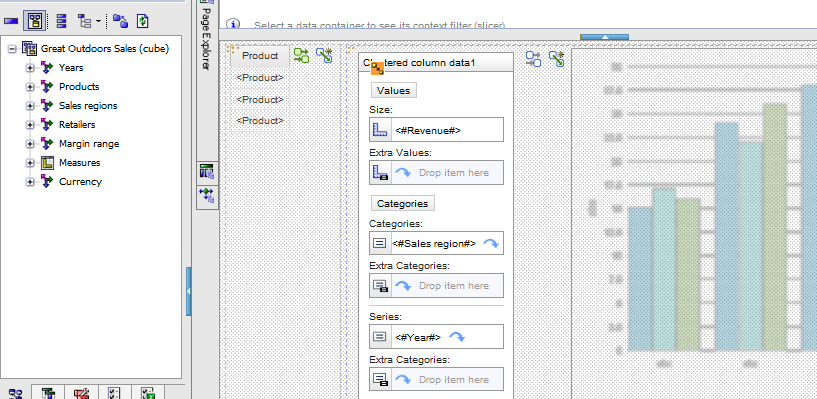
Visualization in version 10.2.1
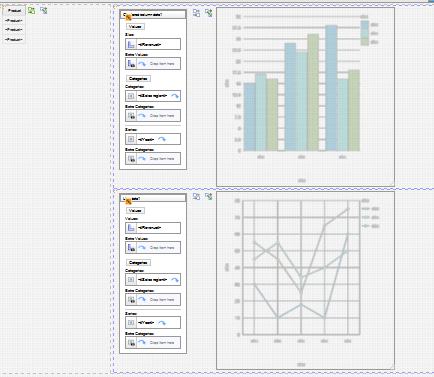
Visualization with different charts in version 10.2.1
Result
Visualization
|
Visualization
| Normal chart | Normal chart | |
Generation time(s)
|
Size(K)
|
Generation time(s)
|
Size(K)
| |
1 Chart
|
0
|
3790
|
0
|
1338
|
275 charts
|
12
|
4159
|
80
|
8380
|
500 charts
|
24
|
4500
|
150
|
15422
|
500 charts with different chart
|
24
|
4517
|
Conclusion
From this result above, we can derive following much promised points
- Dramatically reduced size
- The initial size of Visualization is much bigger than current active report, 3790 vs. 1338, however, most of data is for visualization engine library. (I am not sure client, such as Cognos mobile application need to load such library every time)
- When there are more charts, then the size of Visualization increases very slow, from 3790K to 4159K, 4500K and 4517K respectively. While the size of current version increases very quickly, from 1338K to 8380K, 15422K.
- Speed up report generation time: 5 times quicker
Appendix
Visualization
|
Visualization
| Normal chart | Normal chart | |
report
|
report
|
report
|
report
| |
1 Chart
|
x
|
x
|
x
|
x
|
275 charts
|
x
|
x
|
x
|
x
|
500 charts
|
x
|
x
|
x
|
x
|
500 charts with different chart
|
x
|
No comments:
Post a Comment